
Alien and barren Mars
Click for full resolution. Click here, here, and here for original images.
Click for interactive map.
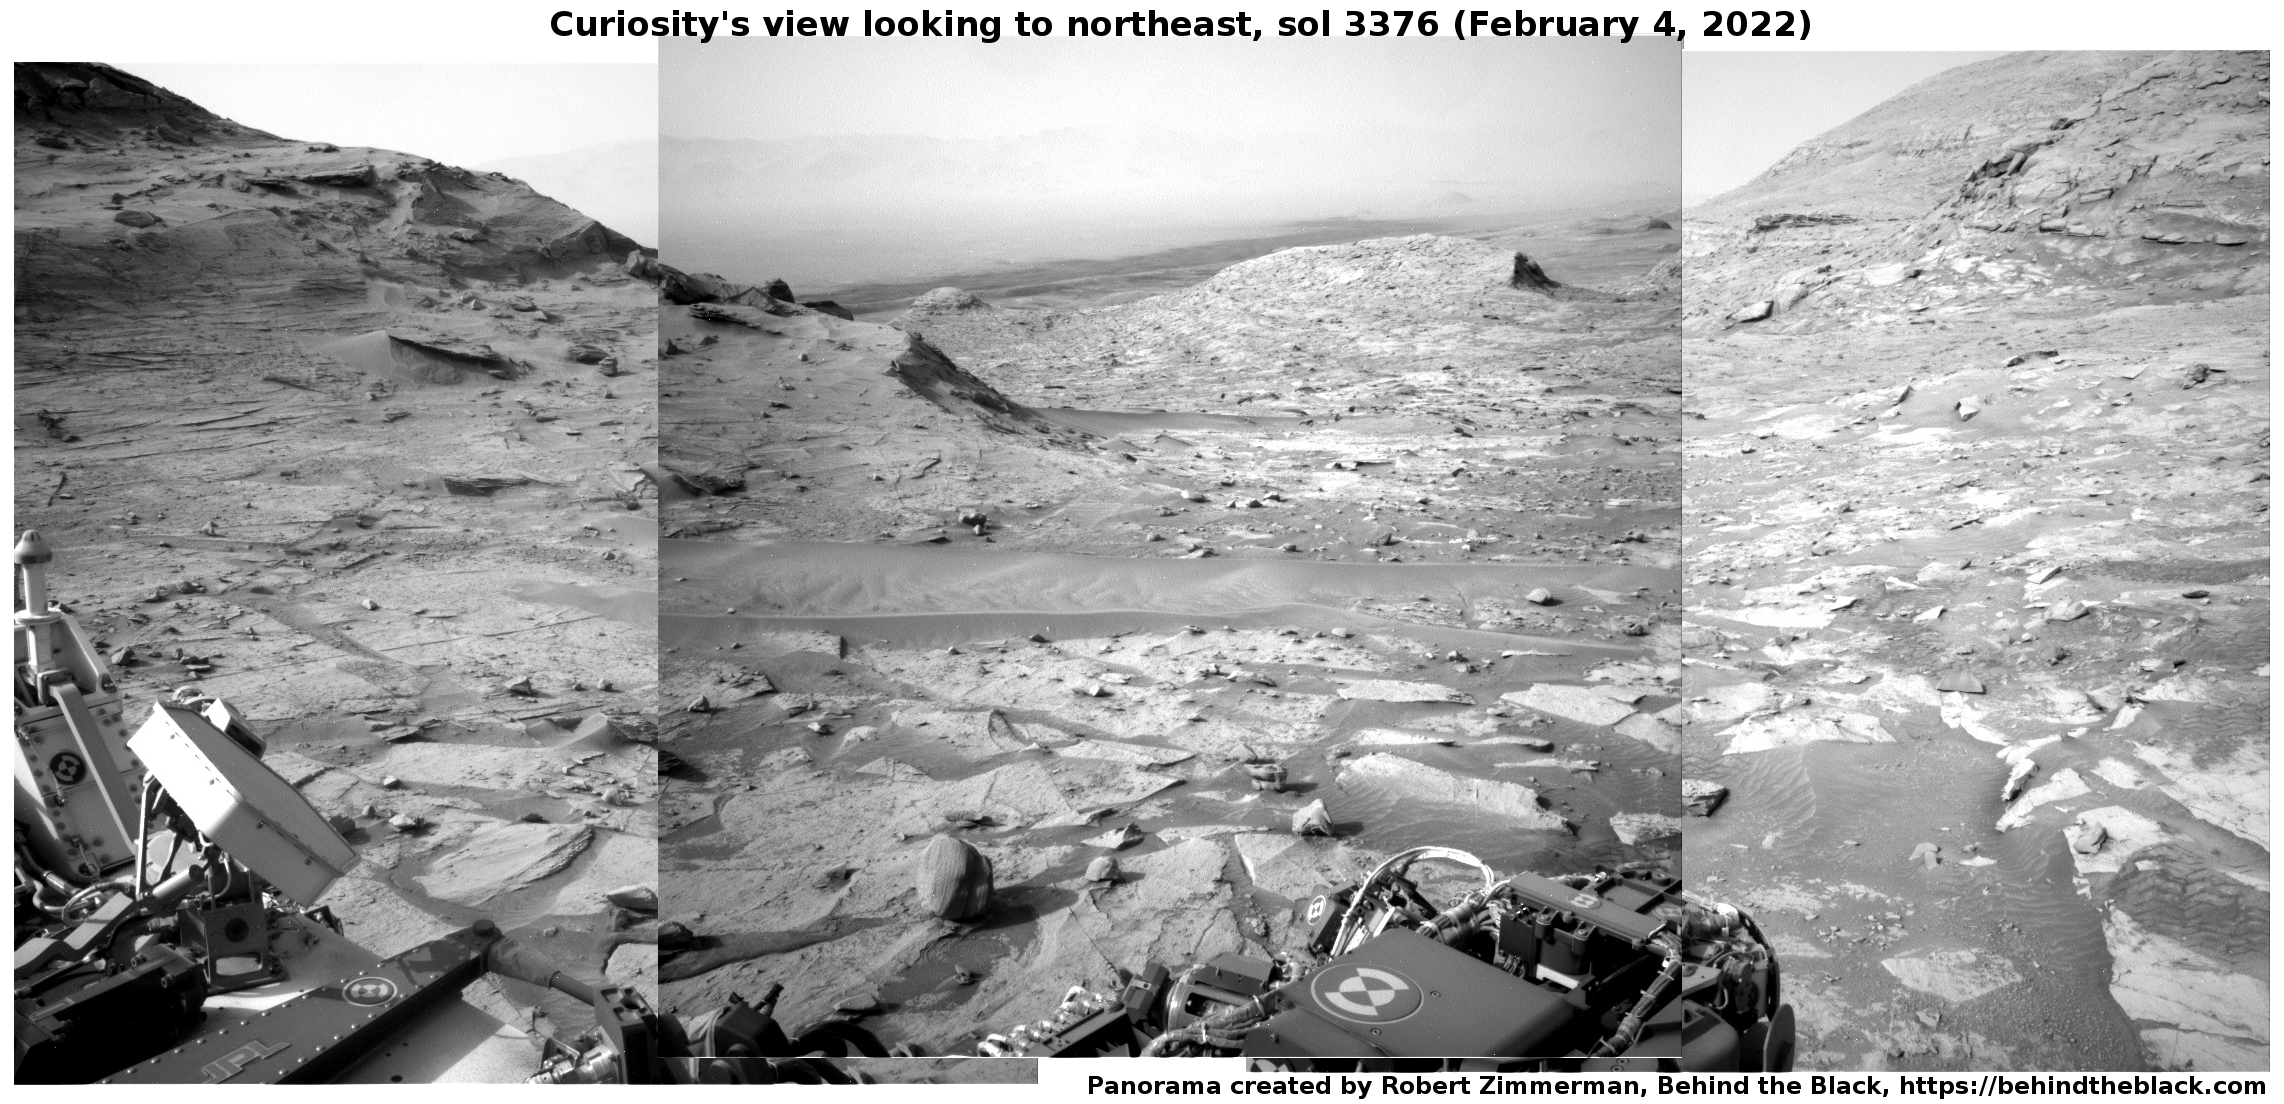
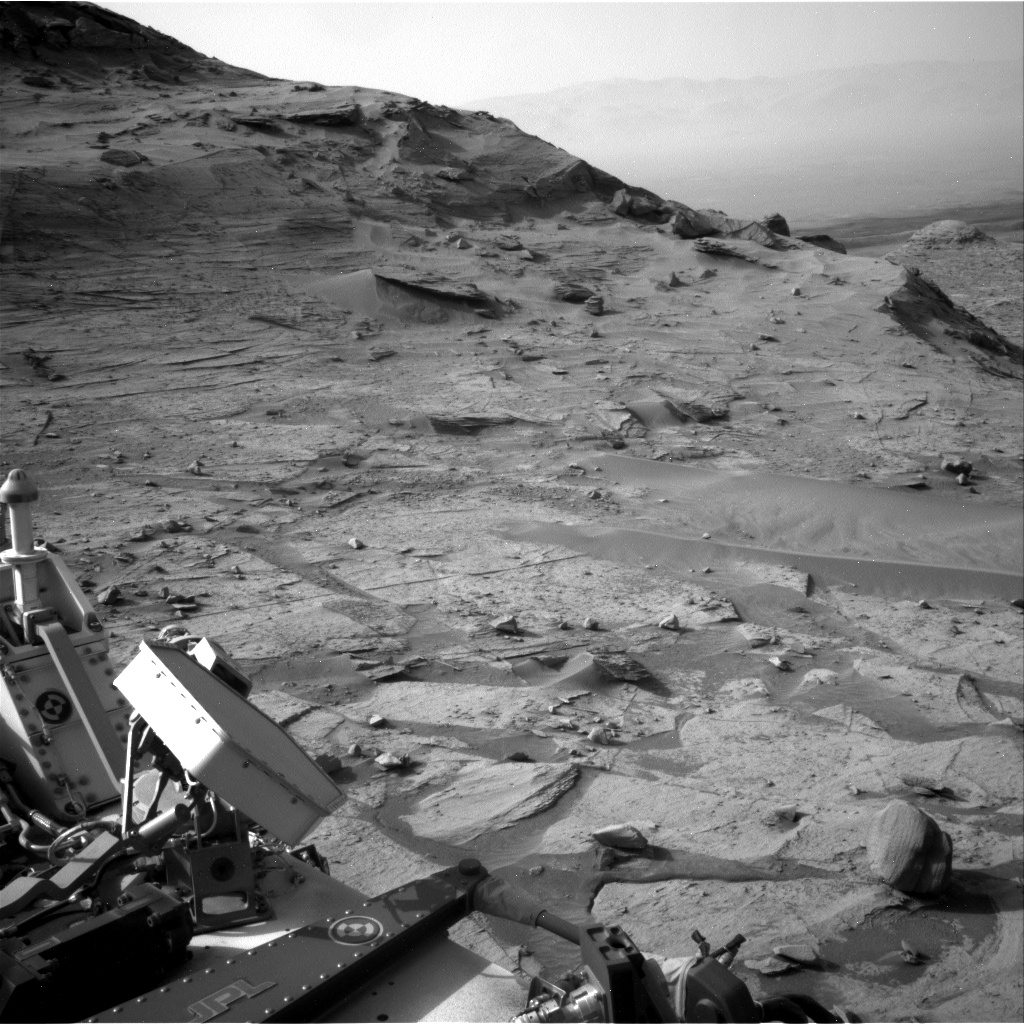
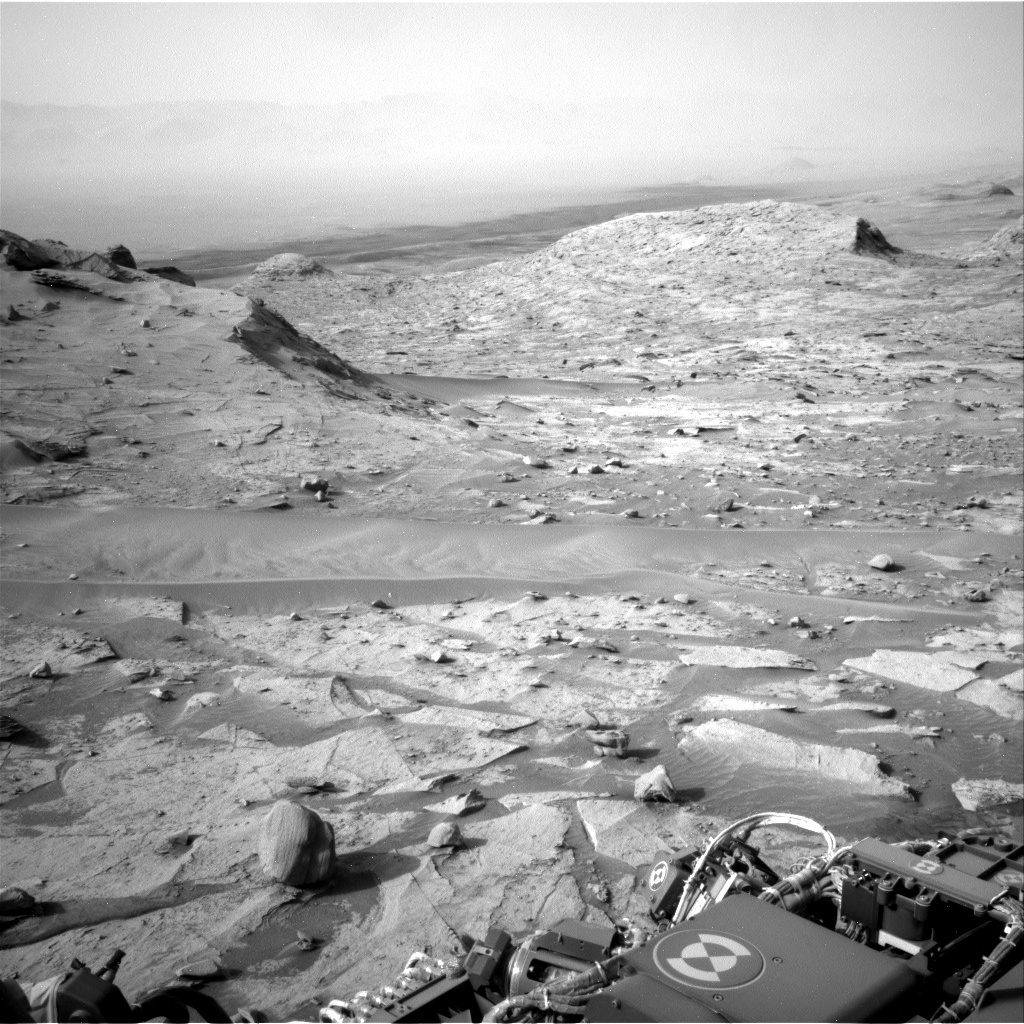
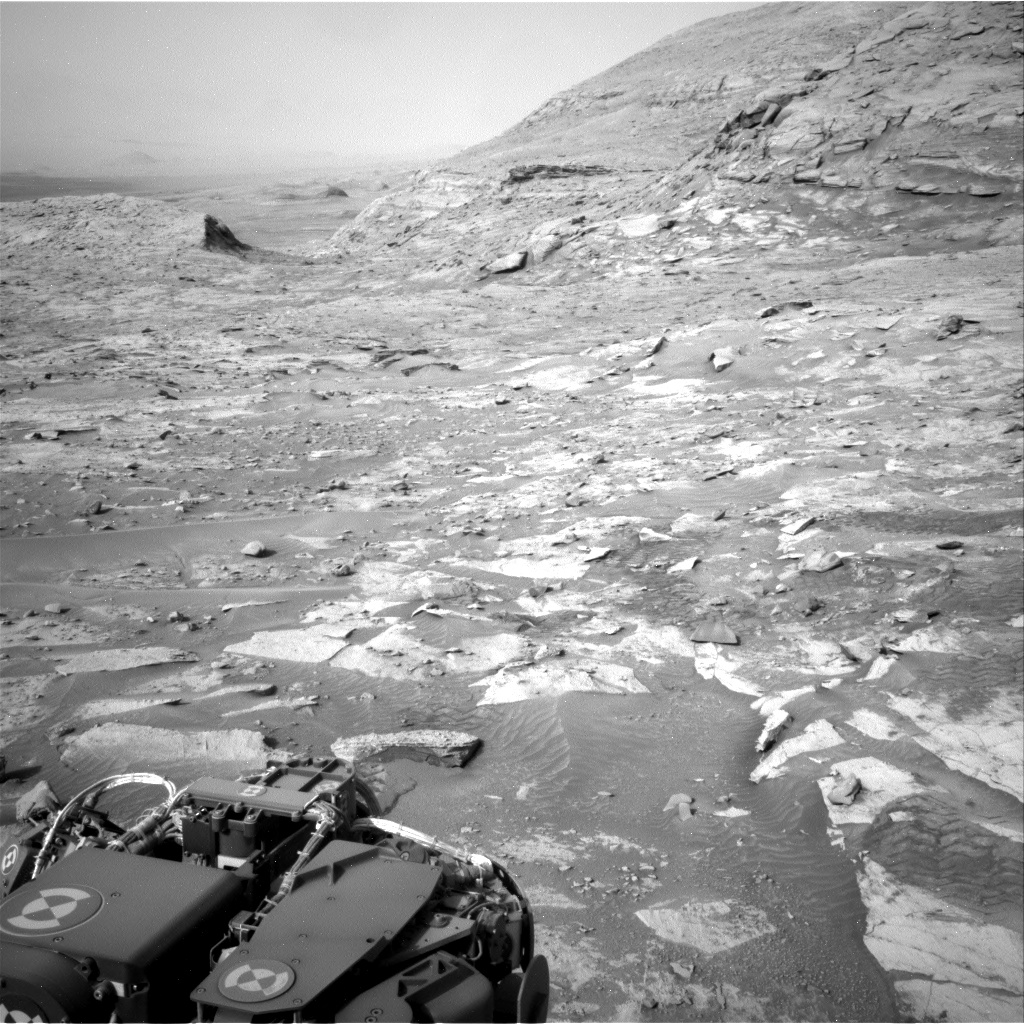
Cool image time! The panorama above was created from three photos downloaded today from Curiosity’s right navigation camera. It looks to the northeast of the rover, out across Gale Crater. The crater floor is about 1,750 feet lower.
This is dust season on Mars, which explains the thick haze in the crater. About 25 miles away the crater rim can be faintly seen through the dust haze as a mountain chain. If you look at the full resolution panorama you can see several buttes on the crater floor barely visible through that haze.
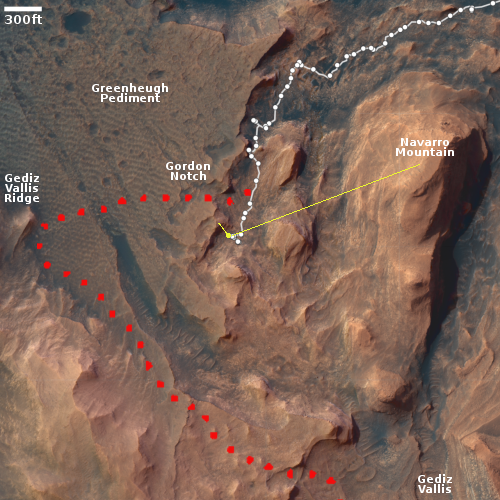
The map to the right gives the context. Curiosity’s present location is indicated by the yellow dot, with the yellow lines indicating the area covered by the panorama. The red dotted line indicates the rover’s future planned route.
For the last few weeks Curiosity has been working nestled to the base of a small butte the science team has dubbed “The Prow”, studying its numerous thin layers. I featured the Prow in this January 11th post, though at the time I overestimated its size, which is only about ten feet high. The butte is especially fascinating in that its top layers overhang outward in an unbelievable manner.
The rover is now about to move on, though where must still be decided by the science team. Based on their most recent update it appears they are not ready to leave this barren rocky hollow surrounded with many-layered buttes, and will take the rover to another.


