Astronomers discover giant arc spanning a third of the night sky

Astronomers have discovered a giant arc of hydrogen gas near the Big Dipper that span a third of the night sky and is thought to be the leftover shockwave from a supernova.

Ultraviolet and narrowband photography have captured the thin and extremely faint trace of hydrogen gas arcing across 30°. The arc, presented at the recent virtual meeting of the American Astronomical Society, is probably the pristine shockwave expanding from a supernova that occurred some 100,000 years ago, and it’s a record-holder for its sheer size on the sky.

Andrea Bracco (University of Paris) and colleagues came upon the Ursa Major Arc serendipitously when looking through the ultraviolet images archived by NASA’s Galaxy Evolution Explorer (GALEX). They were looking for signs of a straight, 2° filament that had been observed two decades ago — but they found out that that length of gas was less straight than they thought, forming instead a small piece of a much larger whole.

This is a great illustration of the uncertainty of science. Earlier observations spotted only 2 degrees of this arc, and thus thought it was a straight filament. Newer more sophisticated observations show that this first conclusion was in error, that it was much bigger, and curved.

I wonder what even more and better observations would reveal.

Antares’ vast blobby atmosphere

The atmosphere of Antares
Click for full image.

Using the Atacama Large Millimeter/submillimeter Array (ALMA) and the Jansky Very Large Array (VLA), astronomers have been able to map out the gigantic atmosphere of gas that surrounds the red gas supergiant star Antares, the closest such star to our solar system.

The ALMA and VLA map of Antares is the most detailed radio map yet of any star, other than the Sun. ALMA observed Antares close to its surface (its optical photosphere) in shorter wavelengths, and the longer wavelengths observed by the VLA revealed the star’s atmosphere further out. As seen in visible light, Antares’ diameter is approximately 700 times larger than the Sun. But when ALMA and the VLA revealed its atmosphere in radio light, the supergiant turned out to be even more gigantic.

“The size of a star can vary dramatically depending on what wavelength of light it is observed with,” explained Eamon O’Gorman of the Dublin Institute for Advanced Studies in Ireland and lead author of the study published in the June 16 edition of the journal Astronomy & Astrophysics. “The longer wavelengths of the VLA revealed the supergiant’s atmosphere out to nearly 12 times the star’s radius.”

The image to the right, cropped and reduced to post here, is what these two telescopes detected. As you can see, the outer atmosphere of the star is very uneven, confirming what other observations of both Antares and Betelgeuse has seen.

These stars are giant gasbags. It appears their shape fluctuates depending on the local “weather” in each star’s atmosphere.

Trace Gas Orbiter detects oxygen layer in Martian atmosphere

Europe’s Trace Gas Orbiter, in orbit around Mars, has detected for the first time the green atmospheric layer in Martian atmosphere caused by the interaction of oxygen and sunlight.

From what I can tell from the press release at the link, they did not “see” this green glow, they detected it spectroscopically. So, any images you see portraying it are simply artist renditions, not the real thing.

The detection is important, nonetheless. First, it confirms that there is oxygen in Mars’ atmosphere. Second, it is the first time this has been detected in the atmosphere other than Earth. Third, the detection matched closely to their computer models, suggesting that the models are a reasonable simulation of this aspect of Mars’ atmosphere.

Lego Antikythera Mechanism

An evening pause: From the youtube webpage:

The Antikythera Mechanism is the oldest known scientific computer, built in Greece at around 100 BCE. Lost for 2000 years, it was recovered from a shipwreck in 1901. But not until a century later was its purpose understood: an astronomical clock that determines the positions of celestial bodies with extraordinary precision. In 2010, we built a fully-functional replica out of Lego.

Hat tip Shaun Karry.

Cassini evidence suggests volcanoes on Titan

Scientists are now proposing that. based on a close look at data and imagery of Titan from the Cassini mission archive, that this moon of Saturn might have volcanoes, and that they might even be active today.

Volcano-like features seen in polar regions of Saturn’s moon Titan by NASA’s Cassini spacecraft could be evidence of explosive eruptions that may continue today, according to a new paper by Planetary Science Institute Senior Scientist Charles A. Wood and coauthor Jani Radebaugh of Brigham Young University.

Morphological features such as nested collapses, elevated ramparts, halos, and islands indicate that some of the abundant small depressions in the north polar region of Titan are volcanic collapse craters, according to “Morphologic Evidence for Volcanic Craters near Titan’s North Polar Region” that appears in the Journal of Geophysical Research: Planets. A few similar depressions occur near the south pole of Titan. “The close association of the proposed volcanic craters with polar lakes is consistent with a volcanic origin through explosive eruptions followed by collapse, as either maars or calderas,” Wood said. “The apparent freshness of some craters may mean that volcanism has been relatively recently active on Titan or even continues today.”

The data being somewhat think, there is a great deal of uncertainty with this theory. Nonetheless, it makes perfect sense, and in fact it would be a surprise if some sort of volcanic activity was not occurring on Titan.

Deciphering the strange geology of Mars — or anything!

Eroding Medusae Fossae Formation ash deposits
Click for full image.

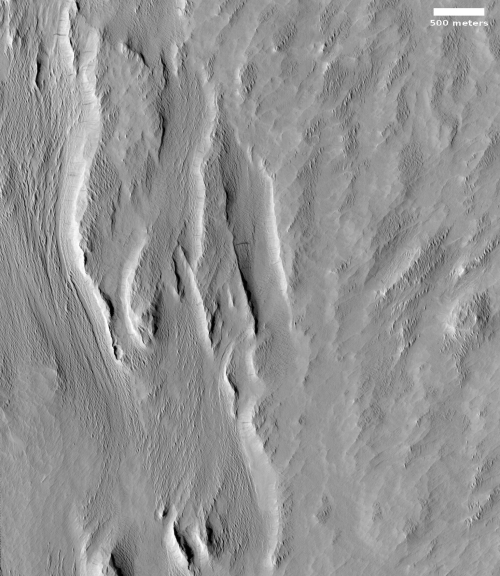
Today’s cool image is for once not taken by the high resolution camera on Mars Reconnaissance Orbiter (MRO). Instead, the image to the right, cropped and reduced to post here, was taken by Mars Odyssey on April 5, 2020, and shows the scouring and erosion caused by winds over many eons in a region dubbed Zephyria Planum. (Note that the image might fool your eye. Sunlight is coming from the east, and the rough terrain at the top is higher than the smooth plain at the bottom.)

Years ago, when I first started to rummage through the archives of images from the various Mars orbiters, I would have seen this image and posted it because I was completely baffled by what I saw, and thought that mystery made it worth showing to the public. Since then my incessant probing of research papers as well as asking a lot of questions of scientists has taught me a lot more about what scientists now surmise of the Martian geology. This greater knowledge in turn makes it possible for me to look at an image like this and immediately make a reasonable guess as to an explanation. This photo, while still containing much that is mysterious, is no longer completely baffling to me.

This willingness to ask questions and dig deeper is fundamental to all things. To have a deeper understanding and not simply guess about any subject, you always have to recognize that your assumptions are likely wrong, and that to learn anything you have to repeatedly ask what I call “the next question.” The first answer will force you to recognize that your first guesses are wrong, raise more questions, which in turn will lead to more questions, and then more questions, and so forth.

Whether I am researching Mars or early space history or politics, this rule always applies. Don’t leap to a conclusion. Think it possible you could be wrong. Ask the next question. And the next. You will repeatedly find that what you thought you knew was not correct, and in the end you will gain a deeper understanding of what is actually known about any subject, as well as what is unknown. And knowing the unknowns is probably the most important thing you can learn.

To gain a better understanding of today’s particular image, our first questions must start with context. Where is this feature on Mars? What is the surrounding history of that location? And what is already known about this place?

The location immediately reveals a great deal, as shown in the overview map below.
» Read more

Dozens of scientists forced out because of foreign ties, mostly with China

An investigation by the National Institute of Health (NIH) has resulted in 54 scientists either resigning or being fired because they had illegally kept secret their financial ties to foreign governments, almost all of which were with China.

Some 54 scientists have resigned or been fired as a result of an ongoing investigation by the National Institutes of Health into the failure of NIH grantees to disclose financial ties to foreign governments. In 93% of those cases, the hidden funding came from a Chinese institution.

The new numbers come from Michael Lauer, NIH’s head of extramural research. Lauer had previously provided some information on the scope of NIH’s investigation, which had targeted 189 scientists at 87 institutions. But his presentation today to a senior advisory panel offered by far the most detailed breakout of an effort NIH launched in August 2018 that has roiled the U.S. biomedical community, and resulted in criminal charges against some prominent researchers, including Charles Lieber, chair of Harvard University’s department of chemistry and chemical biology.

“It’s not what we had hoped, and it’s not a fun task,” NIH Director Francis Collins said in characterizing the ongoing investigation. He called the data “sobering.”

The article, from the liberal journal Science, tries to imply that there is something bigoted about this investigation because the bulk of those forced out happened to be Asian, but that is junk journalism. China itself is bigoted, and targets those of Asian ancestry for its spying. If we are to defend our nation from them, we have to accept the fact that the ethnic statistics here will not be balanced.

The bottom line remains: If you want to get an American government research grant, you cannot have financial ties with hostile foreign governments. And if you lie about those ties, than we can safely assume you are an agent for those hostile governments, and are really a spy subject to arrest and prosecution.

Help scientists plan Curiosity’s future travels

The Curiosity science team is asking the help of ordinary citizens in improving the software it uses to plan Curiosity’s future travels.

Using the online tool AI4Mars to label terrain features in pictures downloaded from the Red Planet, you can train an artificial intelligence algorithm to automatically read the landscape.

Is that a big rock to the left? Could it be sand? Or maybe it’s nice, flat bedrock. AI4Mars, which is hosted on the citizen science website Zooniverse, lets you draw boundaries around terrain and choose one of four labels. Those labels are key to sharpening the Martian terrain-classification algorithm called SPOC (Soil Property and Object Classification).

The goal is not to have citizens plan the rover’s route, but to use their judgments to refine the software that the scientists and engineers use to plan the route. This refinement will also be applicable to Perseverance when it gets to Jezero Crater in February 2021.

Isidis Basin, on whose margin Perseverance will roam

Pedestal craters in Isidis Basin
Click for full image.

Overview map

Today’s cool image to the right, cropped and reduced to post here, highlights the floor of one of Mars’ largest basins, dubbed Isidis Planitia, and located at the transition zone between the planet’s northern lowland plains and the southern cratered highlands.

The overview map below of Isidis Basin provides some context. The white box shows where this particular image is located. Jezero Crater, indicated by the red circle (which is also about the size of the crater), is where the rover Perseverance is going to land and roam come February 2021, should all go well. For scale, Isidis is about the size of the eastern half of the United States. If Chicago was located at Jezero Crater, Baltimore would be on the basin’s eastern edge, at around 4 o’clock.

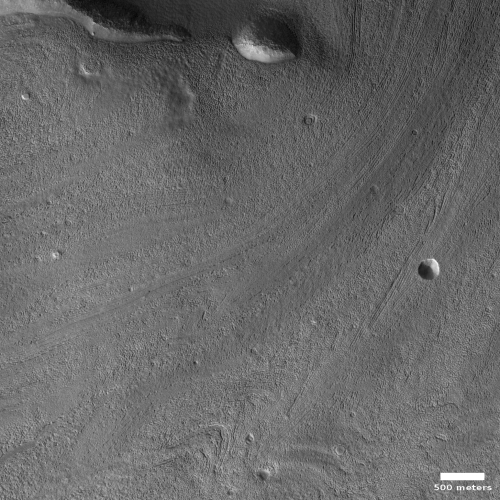
This particular section of the full photo, taken on April 5, 2020 by the high resolution camera on Mars Reconnaissance Orbiter (MRO), shows many features very typical of the floor of Isidis Basin, which also immediately reveal a great deal about its possible history.

In this small snippet we can see what at first glance appear to be pedestal craters standing up like mesas, with ordinary craters scattered about on that lower surrounding terrain. Clearly, if these are pedestal craters they had to have been created first, and then over a very long time erosion processes ate away at that plain, leaving these pedestals (which had become resistant to erosion because the impact had packed their material together and made it harder) behind as mesas.

Then, after this period of erosion was complete enough additional time was required for at least one or two rounds of cratering to occur, leaving behind the many more younger craters on the plain floor, many of which are now partly buried by dust and sand.

The problem is that these mesas are almost certainly not pedestal craters, despite their appearance. » Read more

New Horizons sees stellar parallax

New Horizons is now far enough away from Earth that its perspective of the universe shifts at least two nearby stars into slightly different positions than seen on Earth.

On April 22-23, the spacecraft turned its long-range telescopic camera to a pair of the closest stars, Proxima Centauri and Wolf 359, showing just how they appear in different places than we see from Earth. Scientists have long used this “parallax effect” – how a star appears to shift against its background when seen from different locations — to measure distances to stars.

An easy way to see parallax is to place one finger at arm’s length and watch it jump back and forth when you view it successively with each eye. Similarly, as Earth makes it way around the Sun, the stars shift their positions. But because even the nearest stars are hundreds of thousands of times farther away than the diameter of Earth’s orbit, the parallax shifts are tiny, and can only be measured with precise instrumentation. “No human eye can detect these shifts,” Stern said.

But when New Horizons images are paired with pictures of the same stars taken on the same dates by telescopes on Earth, the parallax shift is instantly visible. The combination yields a 3D view of the stars “floating” in front of their background star fields.

The resulting 3D image, available at the link, is very cool. Both stars clearly appear closer than the surrounding background stars, which of course is true as they are among the closest stars to the Sun.

NASA confirms Webb launch delayed again

NASA officials yesterday confirmed that, due to the new work conditions and the lock down imposed by the Wuhan flu panic, the launch of the James Webb Space telescope will not occur in March 2021.

“We will not launch in March,” said Thomas Zurbuchen, the space agency’s associate administrator for science. “Absolutely we will not launch in March. That is not in the cards right now. That’s not because they did anything wrong. It’s not anyone’s fault or mismanagement.”

Zurbuchen made these comments at a virtual meeting of the National Academies’ Space Studies Board. He said the telescope was already cutting it close on its schedule before the COVID-19 pandemic struck the agency and that the virus had led to additional lost work time. “This team has stayed on its toes and pushed this telescope forward at the maximum speed possible,” he said. “But we’ve lost time. Instead of two shifts fully staffed, we could not do that for all the reasons that we talk about. Not everybody was available. There were positive cases here and there (in the surrounding area, not on site). And so, perhaps, we had only one shift.”

No new target date has been set, though the comments even hinted that they might not be able to do it in 2021.

Webb will cost 20 times more than originally budgeted ($500 million vs $10 billion) and is now more than a decade behind schedule. In the process, those overages and delays wiped out almost all of NASA’s other astronomy projects during the 2010s.

But don’t worry! Once Webb launches the task of wiping out more astronomy projects with overages and delays will be courageously taken up by NASA’s Roman Space Telescope (formerly WFIRST), already behind schedule and over budget, and it is still only in the design phase.

Astrobotic wins contract to land VIPER rover at Moon’s south pole

Capitalism in space: NASA today awarded the private company Astrobotic a $199 million contract to provide the lander that place place the agency’s VIPER rover down near Moon’s south pole.

The target date for the mission is late 2023, and is intended as a scouting mission for the Artemis manned landing to follow.

During its 100-Earth-day mission, the approximately 1,000-pound VIPER rover will roam several miles and use its four science instruments to sample various soil environments. Versions of its three water-hunting instruments are flying to the Moon on earlier CLPS lander deliveries in 2021 and 2022 to help test their performance on the lunar surface prior to VIPER’s mission. The rover also will have a drill to bore approximately 3 feet into the lunar surface.

The key to this mission continues to be NASA’s shift from building things to hiring others to build them. If Astrobotic is successfully, they will then be positioned to offer their lander design to others, since it belongs to them, not NASA.

Fading Martian slope streaks

Fading Martian slope streaks
Click for full image.

Cool image time! I’ve covered the topic of the mysterious slope streaks on Mars previously in great detail (see here and here). Essentially they are generally dark streaks (but sometimes light) that appear randomly on slopes and then fade over time. Unlike recurring slope lineae, another changing streak found on Martian slopes, the coming and going of slope streaks is not tied to the seasons. They can appear at any time in the year, and will take several Martian years to fade away.

The image to the right, rotated, cropped, and reduced to post here, was taken by the high resolution camera on Mars Reconnaissance Orbiter (MRO) on March 26, 2020. It shows numerous slope streaks down the eastern interior rim of a crater in the transition zone between the northern lowlands and the southern cratered highlands in a region dubbed Arabia Terra.

Though I can find no previous high resolution image of this crater to measure any temporal changes, you can clearly see that this slope has experienced many streaks over time, with some darker than others. The different shades suggest that the lighter streaks are older and have faded, with the darker streaks more recent events.

At the moment there is no strong consensus on the causes of these streaks. As one science paper noted, “The processes that form slope streaks remain obscure. No proposed mechanism readily accounts for all of their observed characteristics and peculiarities.” We know they occur in equatorial regions and dusty locations, and that they are triggered by some disturbance at the topmost point of the streak, which then causes a chain reaction down the slope. Other than that, the facts are puzzling, and suggest that these streaks are a phenomenon wholly unique to Mars.

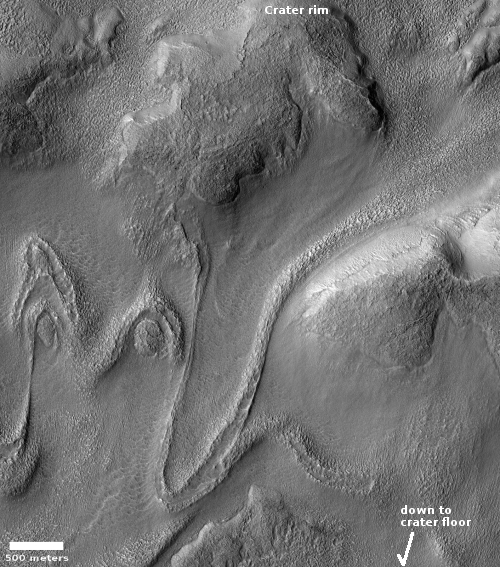
The crater itself, located at 24 degrees north latitude, has some other mysteries. The features on its floor, for instance, are very puzzling. Though suggestive of the buried glaciers found in many craters in the mid-latitudes, this crater is a bit too far south. Maybe its higher altitude allows for some ice to remain here? Then again, the features on that floor might have nothing to do with ice. Maybe we are looking at sand carved by wind? Or hardened mud that was once wet?

I am merely guessing, a dangerous thing to do when one’s knowledge is limited. Then again, it’s fun, so please join in with your own guesses.

Parker successfully completes fifth solar fly-by

The Parker Solar Probe has signaled scientists that it has successfully completed its fifth solar fly-by without damage.

On June 9, 2020, NASA’s Parker Solar Probe signaled the success of its fifth close pass by the Sun, called perihelion, with a radio beacon tone. The spacecraft completed the fifth perihelion of its mission two days prior, flying within 11.6 million miles from the Sun’s surface, reaching a top speed of about 244,225 miles per hour, which matches the spacecraft’s own records for closest human-made object to the Sun and fastest human-made object, set during its fourth orbit on January 29.

Mission controllers at the Johns Hopkins Applied Physics Laboratory in Laurel, Maryland, received a “status A” beacon from the spacecraft at 4:40 p.m. EDT. Status A is the best of four possible status signals, and indicates that the spacecraft is operating nominally and the instrument suites are collecting science data. This beacon tone comes after a five-day period where communications with the spacecraft were not possible.

The data from this fly-by will arrive during the summer. Meanwhile, the spacecraft will next do a fly-by of Venus to slow it down further so that it can get even closer to the Sun on its next orbit.

OSIRIS-REx spots sun-caused erosion on Bennu

Rock on Bennu showing exfoliation
Click for full figure.

An analysis of images taken by OSIRIS-REx of the asteroid Bennu has allowed scientists to identify places where the changing temperatures from day to night has caused the surfaces of rocks to flake away, a process geologists label exfoliation.

The image on the right, cropped and reduced to post here, is from figure 1 in the paper. The yellow arrow points to a typical example of exfoliation, which is a process you can see on many rocks here on Earth.

Rocks expand when sunlight heats them during the day and contract as they cool down at night, causing stress that forms cracks that grow slowly over time. Scientists have thought for a while that thermal fracturing could be an important weathering process on airless objects like asteroids because many experience extreme temperature differences between day and night, compounding the stress. For example, daytime highs on Bennu can reach almost 127 degrees Celsius or about 260 degrees Fahrenheit, and nighttime lows plummet to about minus 73 degrees Celsius or nearly minus 100 degrees Fahrenheit. However, many of the telltale features of thermal fracturing are small, and before OSIRIS-REx got close to Bennu, the high-resolution imagery required to confirm thermal fracturing on asteroids didn’t exist.

The mission team found features consistent with thermal fracturing using the spacecraft’s OSIRIS-REx Camera Suite (OCAMS), which can see features on Bennu smaller than one centimeter (almost 0.4 inches). It found evidence of exfoliation, where thermal fracturing likely caused small, thin layers (1 – 10 centimeters) to flake off of boulder surfaces. The spacecraft also produced images of cracks running through boulders in a north-south direction, along the line of stress that would be produced by thermal fracturing on Bennu.

The typical erosion processes that can cause exfoliation (weather, gravity) are not possible on tiny Bennu, so the solution appears to rest with sunlight and sunlight alone.

This is not really a surprising result, but it is the first time it has been documented by data.

Sunspot update: The deep minimum deepens

NOAA last week did its monthly update of its graph for tracking the monthly activity of sunspots on the Sun’s visible hemisphere. Below is that updated graph, annotated by me to show the past and new solar cycle predictions.

May 2020 sunspot activity

The graph above has been modified to show the predictions of the solar science community for both the previous and upcoming solar maximums. The green curves show the community’s two original predictions from April 2007 for the previous maximum, with half the scientists predicting a very strong maximum and half predicting a weak one. The blue curve is their revised May 2009 prediction. The red curve is the new prediction, first posted by NOAA in April 2020.

Since last month NOAA has done some further revisions to this graph, and improved it significantly since their first redesign, released in April. You can see the difference just by comparing it to my previous update last month. For scales covering longer periods, they have eliminated the diamonds, making the curve much more readable. They have also increased the size of the graph, which also serves to make it more readable as well. Kudos to the people at NOAA for these changes.

As you can see, sunspot activity in May plunged from the slight uptick in April. This is even more clearly shown by the SILSO graph below.
» Read more

Bennu’s forbidding gravelly surface

Gravelly Osprey landing site on Bennu
Click for a higher resolution version.

On May 26 the OSIRIS-REx science team completed their first rehearsal and close approach to their back-up sample-grab-and-go site on Bennu, dubbed Osprey, getting as close as 820 feet. The image to the right, cropped and reduced to post here, shows that sample site within the white box. According to the image caption, the “long, light-colored boulder to the left of the dark patch, named Strix Saxum, is 17 ft (5.2 m) in length.” Note also that they have rotated the image so that east is at the top in order to make it more easily viewed.

This particular spot in this crater is actually a revision from their first choice from early in 2019, which originally was to the right and below the dark patch in the center of the crater. After six months of study, they decided instead on the present target area above the dark patch, because it seemed safer with the most sampleable material.

So how safe is this new location? Let’s take a closer look.
» Read more

An exposed dry waterfall on Mars

An exposed dry waterfall on Mars
Click for full image.

Close overview map

Wide overview map

Cool image time! The photo to the right, cropped and reduced to post here, was taken on April 30, 2020 by the high resolution camera on Mars Reconnaissance Orbiter (MRO). Uncaptioned, the science team titled the release as a “Cataract in Osuga Valles.”

To understand what we are looking at it is necessary to also see a wider view, as provided by the context map below and to the right. As you can see, this image straddles across the canyon called Osuga Valles, and heads downstream to the east. It also shows a point where the grade of that canyon suddenly drops. If water ever flowed here this place would have been the location of a truly spectacular waterfall.

More likely, these cataracts mark the location where sometime in the past a glacier had flowed down this valley, cutting a path until it broke out into the large and wide dead end area that appears to have no clear outlet. For some reason at this point the downhill grade of this canyon suddenly dropped, with the glacier following that sudden steep drop.

There is no glaciers here now, as this location is at 14 degrees south latitude, too close to the equator for any ice to remain close to the surface. Instead, dust dunes remain as the only feature flowing down through these cataracts.

The second overview map provides further context, showing the location of Osuga Valles relative to nearby Valles Marineris, the largest known canyon system in the solar system. Whatever process formed that gigantic canyon system certainly was a factor in forming Osuga Valles. The details however are not yet understood with any certainty. All we presently have are theories.

InSight mole team reports some digging success

InSight scoop pushing against mole as it digs
Click to watch movie.

A new strategy devised in February to use the scoop on the Mars InSight lander to push down on the mole digging tool so that it could gain traction and dig downward has apparently had some success.

We started about seven centimetres above the surface on Sol 458 (11 March) and we are now at the surface with the scoop on Sol 536 (30 May 30), after six cycles of hammering over 11 weeks.

If you click on the image on the right you can see a movie assembled from images taken since February as they pushed down. The mole has clearly descended into the Martian soil about seven centimeters, or about three inches. The issue now, as shown in the movie, is that the mole is now deep enough that the scoop is pressed against the ground. It can’t really push down anymore on the mole, at least in this configuration.

They have the option of using the scoop’s tip to push farther into the ground, but that involves some risk. First they plan to let the mole continue to dig, without the scoop’s help, in the hope that it is now finally deep enough into the ground that the ground is finally able to provide the friction required to hold the mole in place. If this doesn’t work, they will then try using the scoop to fill the hole up to provide more friction.

If that doesn’t work, they will then try using the scoop tip to provide the added pressure.

All in all, it does appear there is now hope that the mole will eventually get the heat sensor for measuring the internal temperatue on Mars deep enough to do its primary mission. Stay tuned!

Rethinking the theories that explain some supernovae

The uncertainty of science: New data now suggests that the previous consensus among astronomers that type Ia supernovae were caused by the interaction of a large red giant star with a white dwarf might be wrong, and that instead the explosion might be triggered by two white dwarfs.

If this new origin theory turns out to be correct, then it might also throw a big wrench into the theory of dark energy.

The evidence that twin white dwarfs drive most, if not all, type Ia supernovae, which account for about 20% of the supernova blasts in the Milky Way, “is more and more overwhelming,” says Dan Maoz, director of Tel Aviv University’s Wise Observatory, which tracks fast-changing phenomena such as supernovae. He says the classic scenario of a white dwarf paired with a large star such as a red giant “doesn’t happen in nature, or quite rarely.”

Which picture prevails has impacts across astronomy: Type Ia supernovae play a vital role in cosmic chemical manufacturing, forging in their fireballs most of the iron and other metals that pervade the universe. The explosions also serve as “standard candles,” assumed to shine with a predictable brightness. Their brightness as seen from Earth provides a cosmic yardstick, used among other things to discover “dark energy,” the unknown force that is accelerating the expansion of the universe. If type Ia supernovae originate as paired white dwarfs, their brightness might not be as consistent as was thought—and they might be less reliable as standard candles.

If type Ia supernovae are not reliable standard candles, then the entire Nobel Prize results that discovered dark energy in the late 1990s are junk, the evidence used to discover it simply unreliable. Dark energy might simply not exist.

What galls me about this possibility is that it was always the case. The certainty in the 1990s about using type Ia supernovae as a standard candle to determine distance was entirely unjustified. Even now astronomers do not really know what causes these explosions. To even consider them to always exhibit the same energy release was just not reasonable.

And yet astronomers in the 1990s did, and thus they fostered the theory of dark energy upon us — that the universe’s expansion was accelerating over vast distances — while winning Nobel Prizes. They still might be right, and dark energy might exist, but it was never very certain, and still is not.

Much of the fault in this does not lie with the astronomers, but with the press, which always likes to sell new theories as a certainty, scoffing over the doubts and areas of ignorance that make the theories questionable. This is just one more example of this, of which I can cite many examples, the worst of all being the reporting about global warming.

Exoplanet in Earth-like orbit circling Sun-type star

Worlds without end: Astronomers have found evidence suggesting the existence of an exoplanet about twice as massive as the Earth and orbiting a solar-twin star in an orbit almost the same as the Earth’s.

The star, Kepler-160, is about 3,000 light years away, and had previously discovered to have two exoplanets.

“Our analysis suggests that Kepler-160 is orbited not by two but by a total of four planets,” Heller summarizes the new study. One of the two planets that Heller and his colleagues found is Kepler-160d, the previously suspected planet responsible for the distorted orbit of Kepler-160c. Kepler-160d does not show any transits in the light curve of the star and so it has been confirmed indirectly. The other planet, formally a planet candidate, is KOI-456.04, probably a transiting planet with a radius of 1.9 Earth radii and an orbital period of 378 days. Given its Sun-like host star, the very Earth-like orbital period results in a very Earth-like insolation from the star – both in terms of the amount of the light received and in terms of the light color. Light from Kepler-160 is visible light very much like sunlight. All things considered, KOI-456.04 sits in a region of the stellar habitable zone – the distance range around a star admitting liquid surface water on an Earth-like planet – that is comparable to the Earth’s position around the Sun.

“KOI-456.01 is relatively large compared to many other planets that are considered potentially habitable. But it’s the combination of this less-than-double the size of the Earth planet and its solar type host star that make it so special and familiar,” Heller clarifies. As a consequence, the surface conditions on KOI-456.04 could be similar to those known on Earth, provided its atmosphere is not too massive and non-Earth-like. The amount of light received from its host star is about 93 percent of the sunlight received on Earth. If KOI-456.04 has a mostly inert atmosphere with a mild Earth-like greenhouse effect, then its surface temperature would be +5 degrees Celsius on average, which is about ten degrees lower than the Earth’s mean global temperature.

These results have many uncertainties, so we should not be surprised if further research produces significant revisions in these conclusions. Nonetheless, the number of Earth-like planets orbiting Sun-like stars in orbits like the Earth’s continues to rise.

The strange squashed ridges at the basement of Mars

Squashed ridges at the basement of Mars
Click for full image.

Overview map

Cool image time! The photo on the right, cropped and reduced to post here, was taken by the high resolution camera on Mars Reconnaissance Orbiter (MRO) on April 9, 2020, and shows the very weird and very packed ridges and layers that are found routinely at the deepest part of Hellas Basin, what I have dubbed the basement of Mars.

Be sure to click on the image to see the full photograph. There’s lots more strangeness to see there. And be sure to read my post in the second link, which highlights a similarly strange set of packed ridges, and where I note:

This is the basement of Mars, what could be called its own Death Valley. The difference however is that unlike Death Valley, conditions here could be more amendable to life, as the lower elevation means the atmosphere is thicker.

The context map to the right shows Hellas, with the location of today’s image indicated by the white box, close to basin’s lowest point, more than five miles below the basin’s rim. Overall the Hellas Basin is about the size of the western United States, from the Mississippi River to the Pacific Ocean. It is believed that the entire basin was created by a single gigantic impact that occurred about four billion years ago when the solar system’s inner planets were undergoing what has been labeled the Late Heavy Bombardment.

The specific process that formed these ridges, dubbed honeycomb terrain by scientists, remains unknown however. There are of course theories, none of which are very convincing. Here’s mine, as outlined in the previous post:
» Read more

Second exoplanet confirmed orbiting Proxima Centauri

Worlds without end: Using archived Hubble data, astronomers have now independently confirmed the existence of a second exoplanet orbiting the nearest star, Proxima Centauri.

Dubbed Proxima c, this is not the same Earth-sized exoplanet confirmed to orbit the star last week. That planet, Proxima b, orbits close to the star every 11.2 days. The new planet is much farther out.

Benedict found a planet with an orbital period of about 1,907 days buried in the 25-year-old Hubble data. This was an independent confirmation of the existence of Proxima Centauri c.

Shortly afterward, a team led by Raffaele Gratton of INAF published images of the planet at several points along its orbit that they had made with the SPHERE instrument on the Very Large Telescope in Chile.

Benedict then combined the findings of all three studies: his own Hubble astrometry, Damasso’s radial velocity studies, and Gratton’s images to greatly refine the mass of Proxima Centauri c. He found that the planet is about 7 times as massive as Earth.

Though I am unaware of any hints of additional planets orbiting Proxima Centauri, the presence of two strongly implies the likelihood of more.

Smallest satellite yet detects exoplanet

The smallest satellite yet, a cubesat, has demonstrated the potential of cubesats to do real cutting edge astronomy by successfully detected a known exoplanet.

Long before it was deployed into low-Earth orbit from the International Space Station in Nov. 2017, the tiny ASTERIA spacecraft had a big goal: to prove that a satellite roughly the size of a briefcase could perform some of the complex tasks much larger space observatories use to study exoplanets, or planets outside our solar system. A new paper soon to be published in the Astronomical Journal describes how ASTERIA (short for Arcsecond Space Telescope Enabling Research in Astrophysics) didn’t just demonstrate it could perform those tasks but went above and beyond, detecting the known exoplanet 55 Cancri e.

Scorching hot and about twice the size of Earth, 55 Cancri e orbits extremely close to its Sun-like parent star. Scientists already knew the planet’s location; looking for it was a way to test ASTERIA’s capabilities. The tiny spacecraft wasn’t initially designed to perform science; rather, as a technology demonstration, the mission’s goal was to develop new capabilities for future missions. The team’s technological leap was to build a small spacecraft that could conduct fine pointing control – essentially the ability to stay very steadily focused on an object for long periods.

…The CubeSat used fine pointing control to detect 55 Cancri e via the transit method, in which scientists look for dips in the brightness of a star caused by a passing planet. When making exoplanet detections this way, a spacecraft’s own movements or vibrations can produce jiggles in the data that could be misinterpreted as changes in the star’s brightness. The spacecraft needs to stay steady and keep the star centered in its field of view. This allows scientists to accurately measure the star’s brightness and identify the tiny changes that indicate the planet has passed in front of it, blocking some of its light.

This success is mostly a proof of concept, but it lays the groundwork for less expensive future space astronomy, using low cost cubesats capable of doing what the expensive orbiting space telescopes have done so far.

Thar’s ice in them Martian hills!

Icy mountains in Erebus Montes?
Click for full image.

Overview map of Starship landing site images

Cool image time! Today we return to the Erebus Mountains, located just to the west of SpaceX’s prime candidate landing site for Starship on Mars. The photo to the right, taken on April 4, 2020 by the high resolution camera on Mars Reconnaissance Orbiter (MRO) and rotated, cropped, and reduced to post here, shows one particular area between the peaks in those mountains, and also happens to be very close to what I have labeled image #1 in SpaceX’s Starship landing site photos.

The second image below and to the right shows an overview map of this region, with the SpaceX photos indicated by the numbered white boxes and the location of this image indicated by the red box, right next to image #1. The black boxes were images that SpaceX had obtained from MRO earlier, when it was first planning to send a Dragon capsule to Mars using a Falcon Heavy, a project the company has put aside in its focus on building Starship.

To my eye, everything in the first image above reeks of an icy, glacial terrain. I certainly am guessing, but it is an educated guess based on looking at numerous similar images in this region (see here and here, ) as well as in the nearby Phlegra mountains to the west. I also base my guess on what I have learned interviewing planetary scientists who are studying these images. The reasonableness of this guess is further strengthened in that the location is at 39 degrees north latitude, dead center in the mid-latitude bands where scientists have found evidence of numerous buried glaciers.

If Starship lands just to the east of the Erebus Mountains, the first colonists will likely not only have water available at their feet close to the surface in the flat lowland plains, if they find that resource insufficient they will need only climb uphill a bit into these hills to dig out as much ice as they could ever need.

Chandra captures black hole outburst over eight months

Four-frame movie of black hole outburst

Astronomers using the Chandra X-ray space telescope have documented the motion of two blobs moving away from a stellar-mass black hole over a period of eight months, producing a four-frame movie from their images and estimating the speed of those blobs to be 80% that of the speed of light.

The gif animation to the right shows that short movie.

The black hole and its companion star make up a system called MAXI J1820+070, located in our Galaxy about 10,000 light years from Earth. The black hole in MAXI J1820+070 has a mass about eight times that of the Sun, identifying it as a so-called stellar-mass black hole, formed by the destruction of a massive star. (This is in contrast to supermassive black holes that contain millions or billions of times the Sun’s mass.)

The companion star orbiting the black hole has about half the mass of the Sun. The black hole’s strong gravity pulls material away from the companion star into an X-ray emitting disk surrounding the black hole.

While some of the hot gas in the disk will cross the “event horizon” (the point of no return) and fall into the black hole, some of it is instead blasted away from the black hole in a pair of short beams of material, or jets. These jets are pointed in opposite directions, launched from outside the event horizon along magnetic field lines. The new footage of this black hole’s behavior is based on four observations obtained with Chandra in November 2018 and February, May, and June of 2019, and reported in a paper led by Mathilde Espinasse of the Université de Paris.

Hubble has produced similar movies of the activity around the Crab Nebula. Sadly, we don’t have enough space telescopes like these in orbit to monitor such objects more frequently and thus photograph their behavior more completely. If we did we’d be able to get a much better understanding of their ongoing activity. We would also be able to produce more movies such as this, with much higher resolution and more continuous coverage.

That Jupiter Trojan comet-like asteroid was neither an asteroid nor a Trojan

Astronomers have now found that the asteroid that had suddenly become active, like a comet, and they had thought was part of the asteroids in Jupiter orbit called Trojans, was neither an asteroid nor a Trojan.

Instead, it is an actual comet captured in a strange unstable orbit around Jupiter.

[W]hen amateur astronomer Sam Deen used software on the Jet Propulsion Laboratory’s solar-system dynamics website to calculate the object’s orbit, he found P/2019 LD2 recently had a close encounter with Jupiter that left its orbit unstable. The model showed that the comet had likely been a Centaur, part of a family of outer solar system asteroids, with an orbit reaching out to Saturn. Then, on February 17, 2017, it passed about 14 million kilometers from Jupiter, an encounter that sent the comet on a wild ride and inserted it into an odd Jupiter-like orbit.

Yet although the swing past Jupiter put P/2019 LD2 into a Jupiter-like orbit, it didn’t move it near to one of the two Lagrange points where the combination of gravitational forces from Jupiter and the Sun hold Trojan asteroids. Instead of being 60° — one-sixth of the giant planet’s orbit — from Jupiter, P/2019 LD2 is only 21° ahead of Jupiter.

The orbit is unstable. It will bring the comet to within 3 million miles of Jupiter in 2063, but beyond that predictions are impossible. The exact closeness of that approach cannot be predicted with much precision, partly because of the chaotic nature of the orbit, and partly because of the random orbital changes that can occur because the comet is venting.

A Martian crater with a straight edge

A mis-shapened crater on Mars
Click for full image.

Cool image time! The image to the right, cropped and reduced to post here, was released today by the science team of the high resolution camera on Mars Reconnaissance Orbiter (MRO). It shows a small Martian crater whose northern rim for some reason is flattened into a straight line. Such a crater is rare, since almost all craters rims are round, even in the case of a low angle impact. The cause is unknown, though there are theories. From the caption, written by Ingrid Daubar of the Lunar and Planetary Laboratory in Arizona:

One possibility is that there was a zone of joints or faults in the crust that existed before the impact. When the impact happened, the crater formed along the straight line of these faults. Something similar happened to Meteor Crater in Arizona. Our image doesn’t show any faults, but they could be beneath the surface.

Perhaps some sort of uneven collapse changed the shape of the crater. There are piles of material on the crater’s floor, especially in the northwest and northeast corners. If those piles fell down from the rim, why did it happen there and not in other places? This crater is near the size where larger craters start to show wall slumping and terraces, so this type of collapse could be occurring unevenly.

The crater is located in the southern cratered highlands of Mars, at about 32 degrees latitude. At that latitude, it is also possible that some past glacial activity could have misshapen this crater, though I have no idea how. The crater itself does not appear to have any glacial material in it.

New observations confirm Earth-like planet orbiting nearest star

Worlds without end: New observations have confirmed the existence of an Earth-sized planet orbiting the nearest star to our Sun, Proxima Centauri, only 4.2 light years away..

The planet, Proxima b, is estimated to have a mass 1.17 of Earth’s, and orbit the star every 11.2 days. Based on that orbit, the planet is also in the star’s habitable zone. Whether there is life there however remains unknown.

Although Proxima b is about 20 times closer to its star than the Earth is to the Sun, it receives comparable energy, so that its surface temperature could mean that water (if there is any) is in liquid form in places and might, therefore, harbour life.

Having said that, although Proxima b is an ideal candidate for biomarker research, there is still a long way to go before we can suggest that life has been able to develop on its surface. In fact, the Proxima star is an active red dwarf that bombards its planet with X rays, receiving about 400 times more than the Earth. “Is there an atmosphere that protects the planet from these deadly rays?” asks Christophe Lovis, a researcher in UNIGE’s Astronomy Department and responsible for ESPRESSO’s scientific performance and data processing. “And if this atmosphere exists, does it contain the chemical elements that promote the development of life (oxygen, for example)? How long have these favourable conditions existed? We’re going to tackle all these questions.

The research data also suggests there might be another planet in orbit around Proxima Centauri, though this conclusion is very preliminary.

1 94 95 96 97 98 277