The so-called Chinese-Russian partnership to explore
the Moon.
According to a statement by Dmitry Rogozin, head of Roscosmos, yesterday in the Russian state-run press, the launch of two unmanned probes to the Moon, Luna-26 and Luna-27, are likely to be postponed due to “the current circumstances.”
“As for the Luna-26 lunar orbiter and the Luna-27 heavy lander mission, possibly, it will be adjusted taking into account that in the current situation we will be spending the main financial and industrial resources on increasing the orbital group. Now it is more important,” the space chief emphasized.
The Roscosmos CEO also asked for understanding if the mission is postponed. “Science is very important but now we are talking about the viability of Russia’s orbital group, about bringing it to a new level, its work as a group of double and military designation. Yet we are not postponing the lunar missions for long,” he added.
Rogozin added that Luna-25, scheduled for launch this year, has not been postponed.
Apparently the more than $1 billion of income that Roscosmos has lost by its refusal to launch OneWeb’s satellites is forcing it to make choices. For the government, the priority has to be launching communications, weather, navigation, and military surveillance satellites. Being tight on cash, Rogozin thus has no recourse but to favor those launches over any purely science missions.
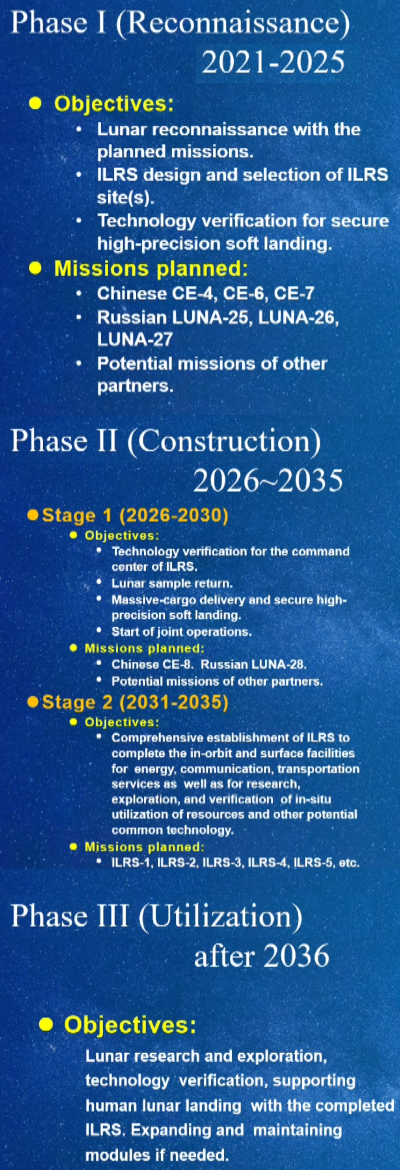
This decision also demonstrates that Russia’s so-called partnership with China to explore the Moon, as shown in the graphic to the right that was released by China and Russia in June 2021, is pure hogwash. as I noted then:
Of the three Russian missions, Luna 25 is scheduled to launch later this year, making it the first all-Russian-built planetary mission in years and the first back to the Moon since the 1970s. The other two Russian probes [Luna-26 and Luna-27] are supposedly under development, but based on Russia’s recent track record in the past two decades for promised space projects, we have no guarantee they will fly as scheduled, or even fly at all.
Rogozin also said yesterday that he plans further talks with China in May to further their partnership concerning lunar exploration and building a lunar base. Let me translate: “We need cash to launch anything, and hope the Chinese will provide some.”


