NOAA awards contract to private company for solar observatory

Capitalism in space: NOAA today awarded a contract to the private company Xplore to study development of a commercial solar observatory at the Earth-Sun L1 point.

The press release at the link is somewhat vague about the contract. It appears to be a study to see if Xplore’s proposed Xcraft spacecraft can be used as platform for such a solar observatory, not an actual contract to build the observatory.

Regardless, this award is a strong indicator that the Trump administration is applying pressure at NOAA to get it out of the business of building weather satellites and instead be a customer buying such satellites from the private sector. The weather agency has been, like NASA earlier this decade, resistant to this concept, with its bureaucracy wanting to retain control over everything. Maybe the success of SpaceX at NASA is now helping to fuel the change at NOAA.

Let us hope so. NOAA’s present fleet of solar observatories in space is years past their due date, with no sign of a replacement fleet. The agency just can’t seem to get its act together to build these satellites. For example, NOAA has been trying and failing to build a new solar observatory to monitor sunspot activity now for more than a decade.

Maybe, like NASA, giving the job to private enterprise might get things going.

Sunspot update: The deep minimum deepens

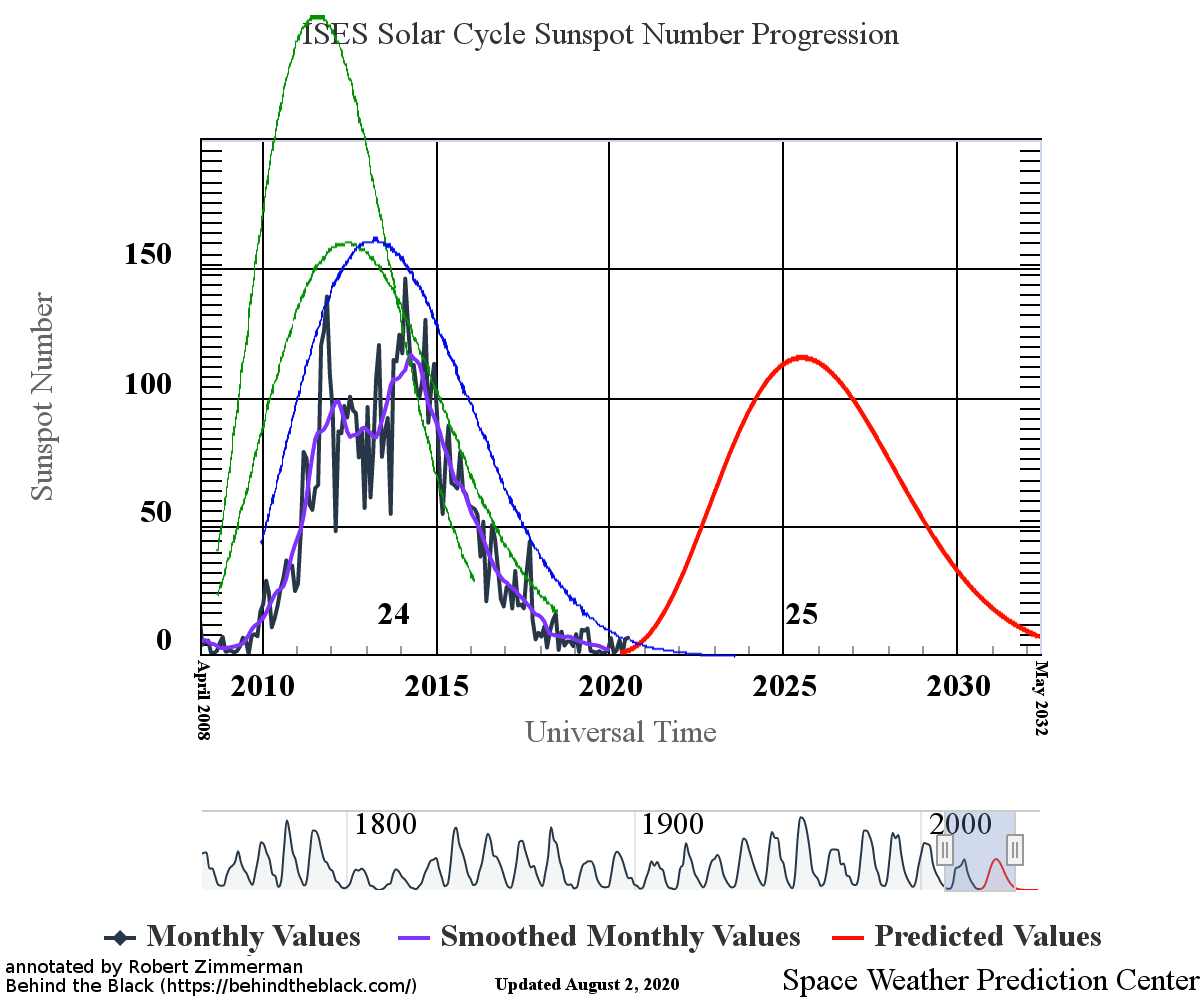
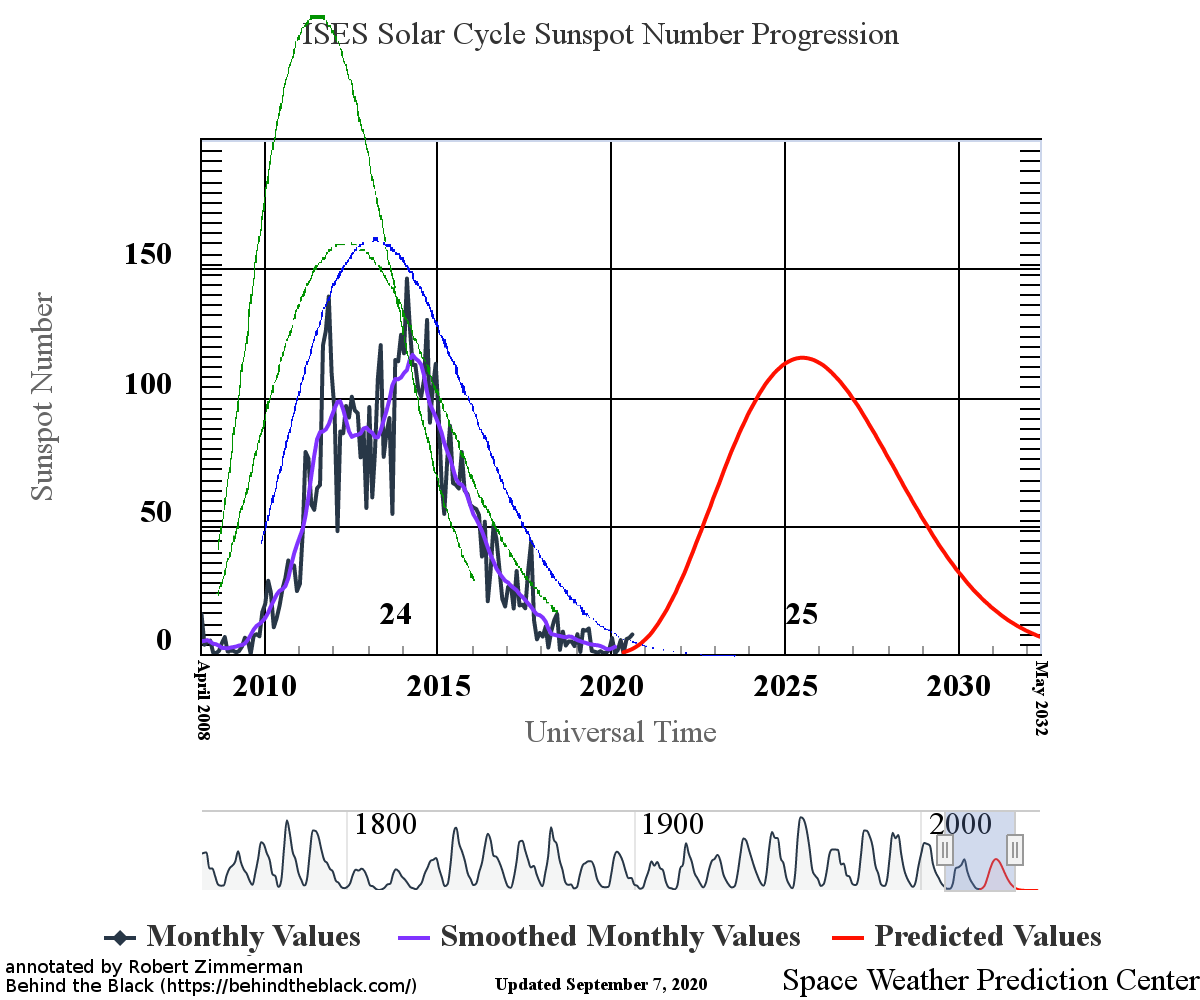
NOAA last week did its monthly update of its graph for tracking the monthly activity of sunspots on the Sun’s visible hemisphere. Below is that updated graph, annotated by me to show the past and new solar cycle predictions.

May 2020 sunspot activity

The graph above has been modified to show the predictions of the solar science community for both the previous and upcoming solar maximums. The green curves show the community’s two original predictions from April 2007 for the previous maximum, with half the scientists predicting a very strong maximum and half predicting a weak one. The blue curve is their revised May 2009 prediction. The red curve is the new prediction, first posted by NOAA in April 2020.

Since last month NOAA has done some further revisions to this graph, and improved it significantly since their first redesign, released in April. You can see the difference just by comparing it to my previous update last month. For scales covering longer periods, they have eliminated the diamonds, making the curve much more readable. They have also increased the size of the graph, which also serves to make it more readable as well. Kudos to the people at NOAA for these changes.

As you can see, sunspot activity in May plunged from the slight uptick in April. This is even more clearly shown by the SILSO graph below.
» Read more

Sunspot update: The deep minimum continues

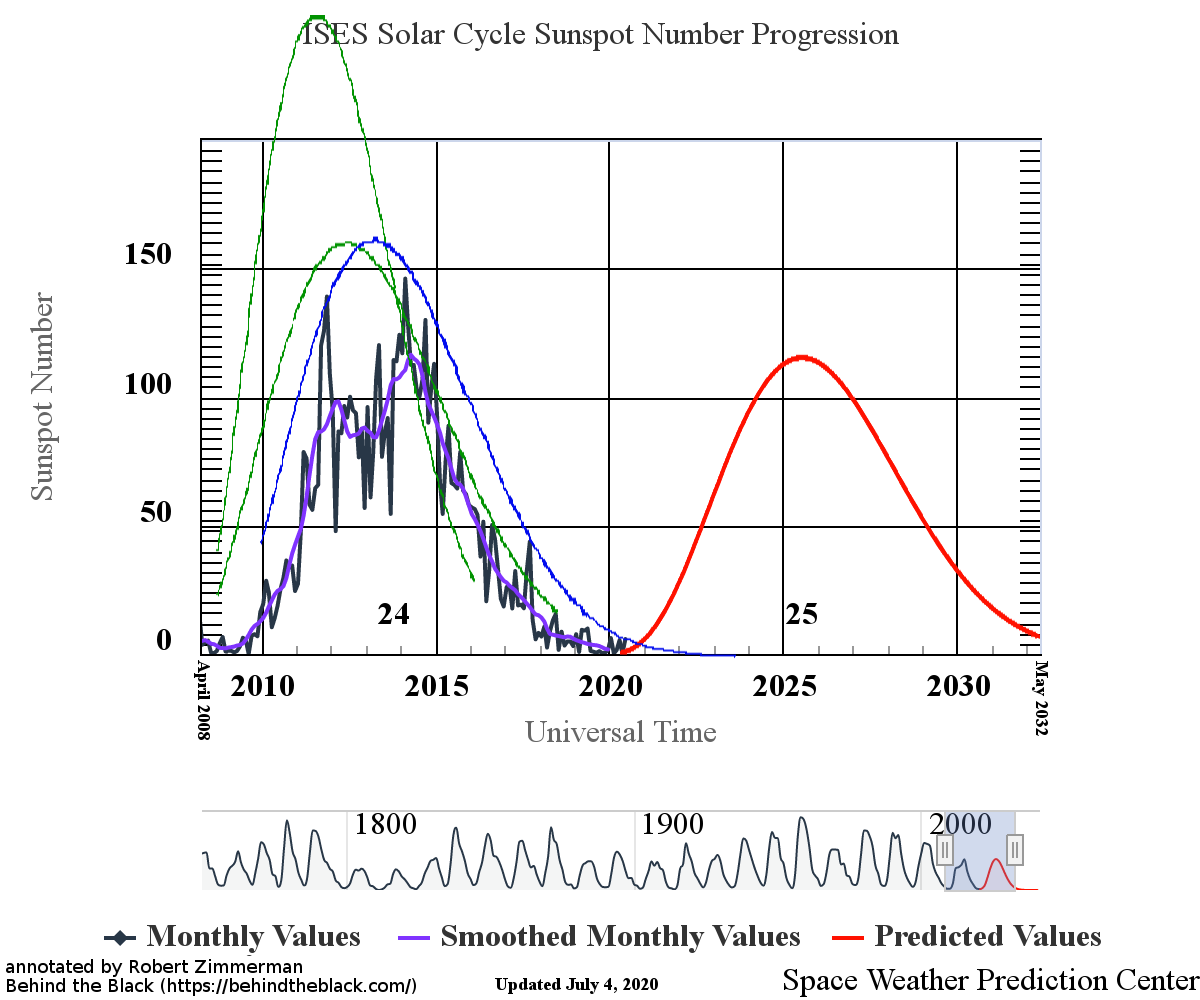
Last week NOAA updated its graph for tracking the monthly activity of sunspots on the Sun’s visible hemisphere. Below is that updated graph, annotated by me to show the past and new solar cycle predictions.

April 2020 sunspot activity

The graph above has been modified to show the predictions of the solar science community for both the previous and upcoming solar maximums. The green curves show the community’s two original predictions from April 2007 for the previous maximum, with half the scientists predicting a very strong maximum and half predicting a weak one. The blue curve is their revised May 2009 prediction. The red curve is the new prediction, first posted by NOAA in April 2020.

Because of the design of this graph, revamped by NOAA in April, it is difficult at this scale — which for context shows both the past cycle and the predicted future cycle — to see the addition of the April sunspot total, when compared to last month’s graph. Trust me, it is there. In April sunspot activity went up, but trivially so, with only four sunspots during the month, three of which had a magnetic polarity assigning them to the next solar maximum.

The solar minimum remains very deep, deeper than the very deep previous minimum, and possibly the least active in two hundred years. The presence however of more sunspots for the new cycle strengthens the expectation that we will not be entering a grand minimum, with no sunspots for decades. It just appears that, as predicted, the next solar maximum will be a very weak one.

How this weak activity will effect the climate remains an unknown. In the past, such as the weak maximum that just ended as well as during past weak maximums at the beginning of the 1800s and the 1900s, the Earth’s climate cooled. It also cooled during the Little Ice Age in the 1600s, during the last grand minimum.

Whether the same will happen in the next decade remains unknown. Global warming activists will claim impossible, we are all going to die from overheating. The data for the past decade proves them wrong, though in the coming years they might be vindicated.

All we can do is wait, pay attention to the data, and make our conclusions from that.

The Sun fluctuates far less than other similar stars

A new survey of 369 sun-like stars has confirmed what earlier studies have shown, that the Sun is remarkable inactive compared with similar stars.

A comprehensive catalogue containing the rotation periods of thousands of stars has been available only for the last few years. It is based on measurement data from NASA’s Kepler Space Telescope, which recorded the brightness fluctuations of approximately 150000 main sequence stars (i.e. those that are in the middle of their lifetimes) from 2009 to 2013. The researchers scoured this huge sample and selected those stars that rotate once around their own axis within 20 to 30 days. The Sun needs about 24.5 days for this. The researchers were able to further narrow down this sample by using data from the European Gaia Space Telescope. In the end, 369 stars remained, which also resemble the Sun in other fundamental properties.

The exact analysis of the brightness variations of these stars from 2009 to 2013 reveals a clear picture. While between active and inactive phases solar irradiance fluctuated on average by just 0.07 percent, the other stars showed much larger variation. Their fluctuations were typically about five times as strong. “We were very surprised that most of the Sun-like stars are so much more active than the Sun,” says Dr. Alexander Shapiro of MPS.

It is possible that this inactivity might be because the Sun just happens to be going through a quiet phase, but that is becoming increasingly less likely as the surveys find more and more sun-like stars, and none as inactive as the Sun.

If the Sun is this unusual, we must ask if this inactivity is a fundamental requirement for life to form. Active stars provide a more inhospitable environment. If inactive stars like the Sun are very rare, however, that suggests that life itself in the universe could be very rare as well.

NOAA’s prediction for the next solar maximum

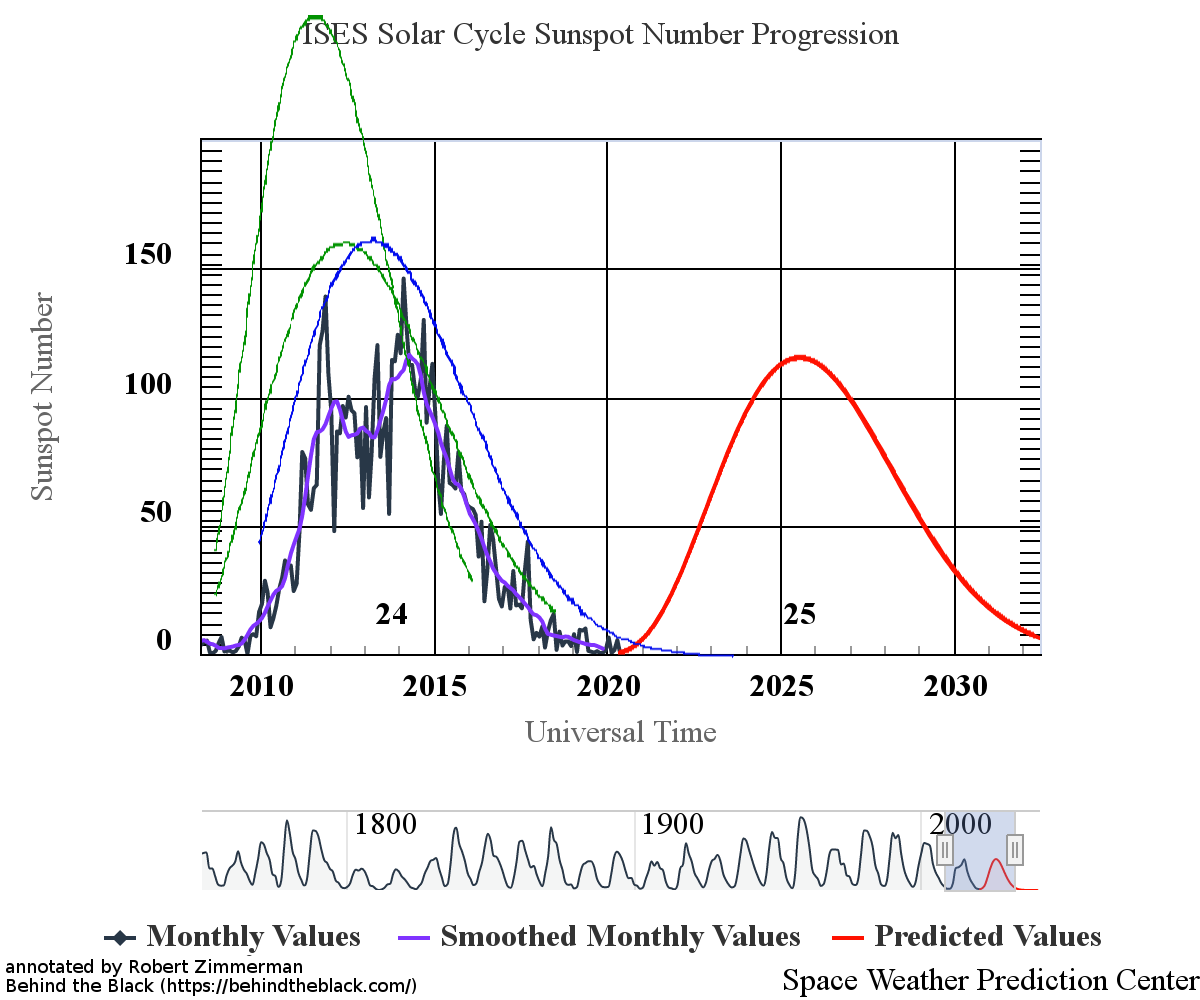
Last week NOAA introduced a newly revamped graph for tracking the monthly activity of sunspots on the Sun’s visible hemisphere. (You can see an example of the old graph, used by them for more than fifteen years, here.)

In order to properly understand the context of future sunspot activity, it is important to understand how the new graph aligns with the old. My first attempt to do so in my April 3, 2020 sunspot update, unfortunately was a failure. While most of my conclusions in that update remain correct, my attempt to place NOAA’s prediction for the next solar cycle on my graph was in error.

I had not realized that NOAA had changed its sunspot number scale on the graph’s vertical axis. In their old graph they had used the monthly sunspot number count from the Royal Observatory of Belgium. The new graph instead used the sunspot number from NOAA’s own Space Weather Prediction Center (SWPC). Both numbers are creditable, but the solar scientist community has switched entirely to the latter in the past few years because they consider its criteria for determining the count across all past cycles to be more accurate.

The Belgium numbers have traditionally been about one third lower than SWPC’s. Not realizing that NOAA’s new prediction was based on the SWPC numbers, I therefore placed it on the graph using the Belgium numbers and thus made the peak of the solar maximum 33% too high.

Below is NOAA’s new graph, annotated properly with both the past and new solar cycle predictions added now correctly.
» Read more

Sunspot update: tiny uptick in March activity

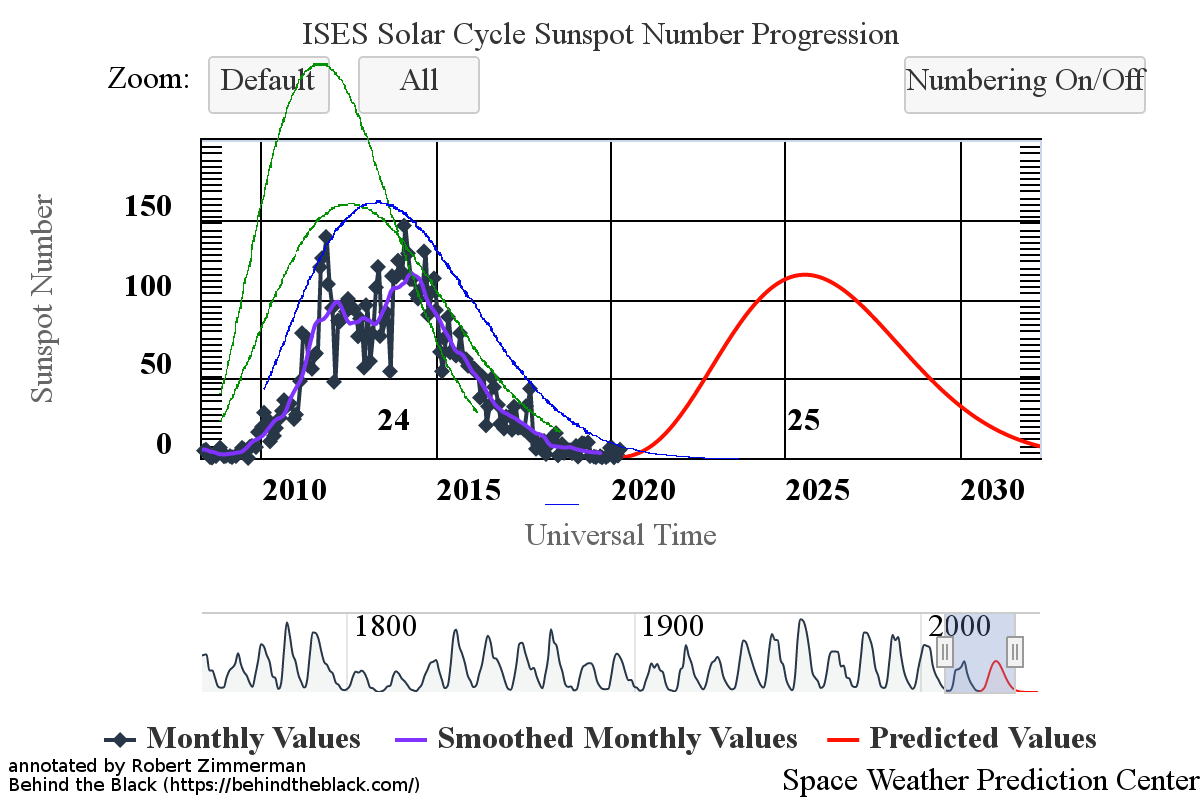
UPDATE: In doing some analysis and prep work for future updates, I have discovered that the graph below is in error in its placement of the prediction for the next solar maximum in 2025. I have revised the graph below to note the error. On April 6, 2020 I posted an updated graph.

My original post:
—————————
This week NOAA unveiled a major revamping of the graph it has used for the past decade-plus to show the monthly progression of the sunspot cycle, and that I have been using since the start of this website to do my monthly sunspot updates.

Overall they did a very nice job. The new graph not only shows the present state of the cycle, but it allows you to zoom in or out on this cycle as well as all sunspot cycles going back to 1750, about the time the sunspot cycle was first recognized and the sunspot count became reliable.

The new graph also includes a new more precise prediction for the upcoming solar cycle, forecasting the peak in 2025, higher than the weak solar maximum that has just passed. I have taken the old graph (see my last update on March 12, 2020) and revised it to place this new prediction in context with the previous cycle. I have also added the March sunspot numbers to it.
» Read more

Sunspot update: The flatline resumes

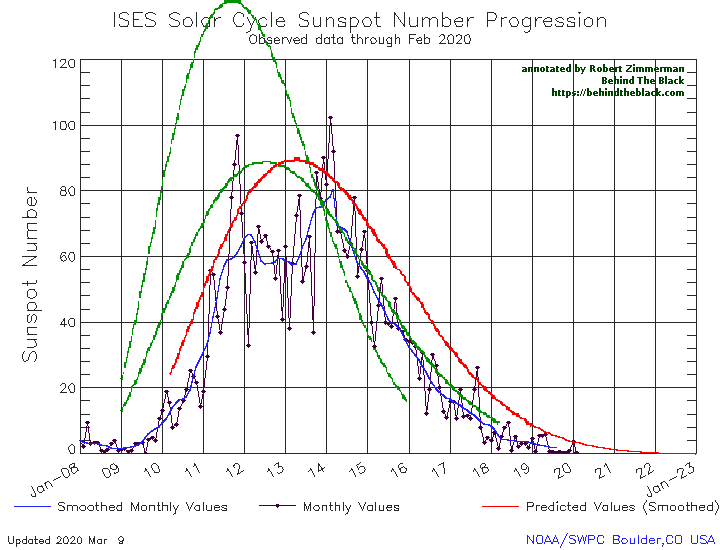
NOAA this week released its February update of its monthly graph showing the long term sunspot activity of the Sun. Below is my monthly version, annotated as I have done every month since 2011.

After a tiny uptick in sunspot activity in January, the Sun resumed the unprecedented flatlining of sunspot activity that began last June. Since then, the Sun has produced practically no sunspots, a drought that as far as I can tell has never happened since the 11-year sunspot cycle resumed in the 1700s (after the grand minimum in the 1600s) and astronomers began counting sunspots.

February 2020 sunspot activity
The graph above has been modified to show the predictions of the solar science community for the previous solar maximum. The green curves show the community’s two original predictions from April 2007, with half the scientists predicting a very strong maximum and half predicting a weak one. The red curve is their revised May 2009 prediction, extended in November 2018 four years into the future.

February saw only one sunspot, and it belonged to the old solar cycle. It also occurred at the beginning of the month, and was followed by 33-day streak of blankness, into the middle of March, when a sunspot from the new cycle appeared and quickly faded.

The continuing overall lack of sunspots, from either the old or new cycle, does not mean that we are entering a new grand minimum, with no sunspots for decades (though some scientists believe we are). It does suggest however that the next solar maximum will be weak, and very likely weaker than the very weak maximum that just ended.

Why the Sun does this remains a mystery. Scientists really have no fundamental understanding of the magnetic processes that produce the Sun’s sunspot cycles. And since that cycle appears to have some effect on the Earth’s climate, it also means scientists do not yet have a fundamental understanding of the climate either.

Not that this lack of knowledge matters anymore. We are in an age of panic and certainty, based on emotion and feelings. All that matters is that many people feel they understand the climate and how the Sun works, just as everyone is sure that COVID-19 will destroy the world if we don’t shut down all human activity.

They are certain, and any additional data that illustrates that certainty is unwarranted is irrelevant and must be ignored.

Certainty however is a very dangerous thing. The universe is always more complicated than we know, and to assume we now understand all without doubt leaves us very vulnerable to some bad surprises, as well as the chance we will take actions that are foolish, inappropriate, and even downright evil.

Sunspot update: The record flatline continues

In the month of December 2019 the Sun continued its longest stretch of overall sunspot inactivity ever recorded, reaching seven months in length. At no point since the last grand minimum in the 1600s have scientists ever seen so few sunspots over so long a time period.

Below is NOAA’s December update of its graph showing the long term sunspot activity of the Sun. As I have done now every month since this webpage began in 2011, it is posted below, with annotations:
» Read more

Sunspot update Nov 2019: The longest flatline in centuries

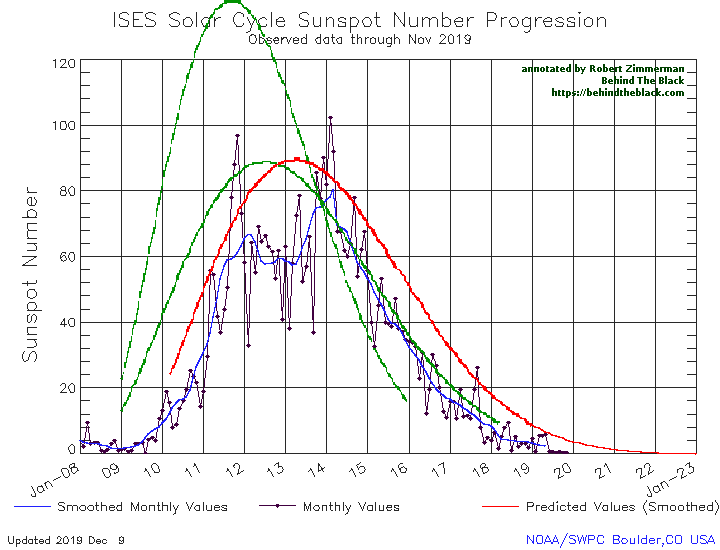
The Sun is now in what appears to be the longest stretch ever recorded, since the 11-year solar sunspot cycle reactivated in the 1700s after the last grand minimum, of sunspot inactivity. This record-setting dearth of practically no sunspots has now stretched to six months in a row.

On December 8 NOAA released its November update of its graph showing the long term sunspot activity of the Sun. As I have done now every month since this webpage began in 2011, I have posted it below, with annotations:

November 2019 sunspot activity
The graph above has been modified to show the predictions of the solar science community for the previous solar maximum. The green curves show the community’s two original predictions from April 2007, with half the scientists predicting a very strong maximum and half predicting a weak one. The red curve is their revised May 2009 prediction, extended in November 2018 four years into the future.

In November the Sun saw two official sunspots (here and here) and one active area that never received an official sunspot number, with two of these three weak events having a polarity linking them to the next solar maximum.
» Read more

Sunspot update October 2019: Sunspot activity continues to flatline

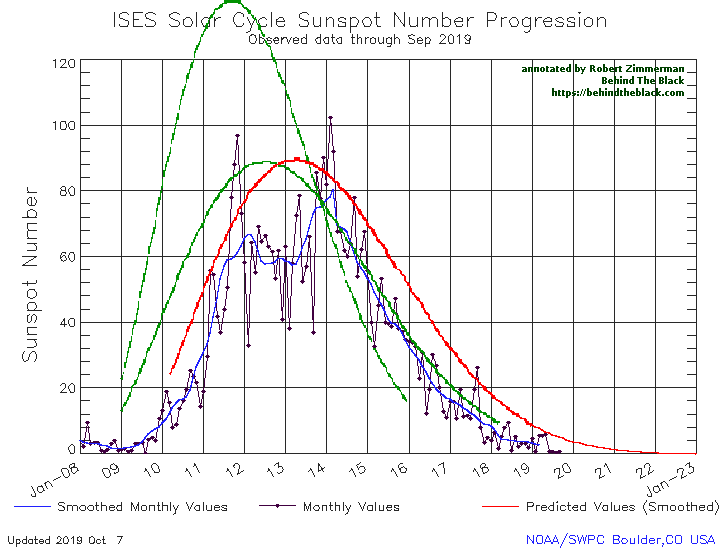
For the fifth month in a row the Sun has produced practically no sunspots, possibly the longest such stretch since astronomers began recording the sunspot cycle in the 1700s.

This flatlining is very obvious in NOAA’s October update of its graph showing the long term sunspot activity of the Sun, released yesterday, and posted below, with annotations:
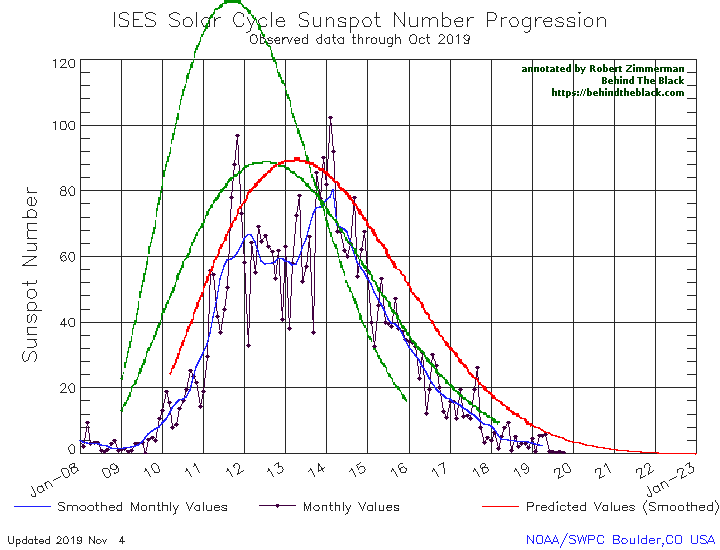
October 2019 sunspot activity
The graph above has been modified to show the predictions of the solar science community for the previous solar maximum. The green curves show the community’s two original predictions from April 2007, with half the scientists predicting a very strong maximum and half predicting a weak one. The red curve is their revised May 2009 prediction, extended in November 2018 four years into the future.
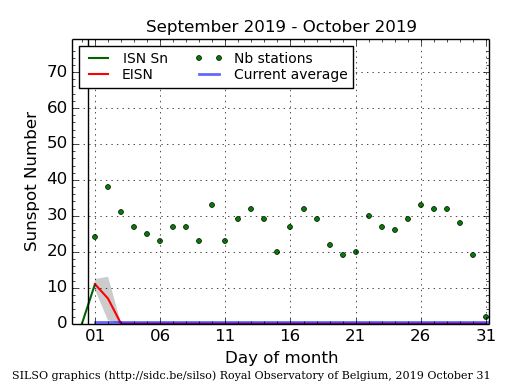
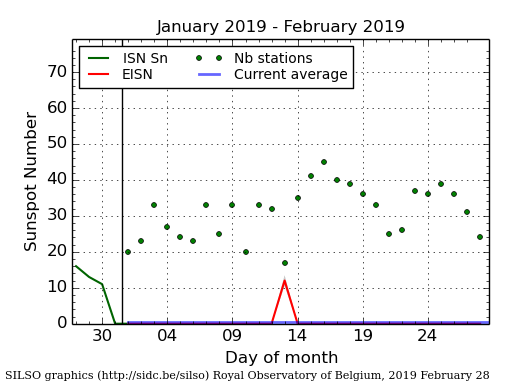
SILSO October graph

As it has done in previous four months, in October the Sun produced practically no sunspots. The graph on the right, produced by Sunspot Index and Long-term Solar Observations (SILSO), shows only one weak sunspot at the beginning of October.

Even though the previous 2008-2009 solar minimum was one of the deepest and longest ever recorded, the lack of sunspots in the past five months has significantly beaten it for inactivity, as shown on the first graph above. That previous minimum never had a period of even two months with so few sunspots. Furthermore, the Sun has now been blank 74% of the time in 2019, a record of blankness that beats the yearly record of either 2008 or 2009. If the Sun continues to be as blank as it has been for the next two months, 2019 will easily set the record for the year with the fewest sunspots ever recorded.

The big question remains: Are we heading for a grand minimum with no sunspots for decades? We still do not know. Even these unprecedented trends prove nothing, as we really do not yet have a clear understanding of why the Sun undergoes these various cycles of sunspot activity/inactivity. The Sun could still come back to life in the coming years. We can only wait and see. As I noted however in last month’s sunspot update, the arrival of a new grand minumum, the first since the 1600s, could have important consequences:

During past grand minimums there is evidence that the Earth also cooled, though the link between the two phenomenon remains circumstantial and unproven. If we see another grand minimum, and the Earth once again cools, then we might be able to finally tie these two phenomenon together.

It is essential that climate scientists pursue this question. Answering it might very well defuse the fears presently expressed by leftist politicians and the leftist press of an oncoming period of global warming.

At the same time, it might also present us with the possibility of an oncoming period of significant global cooling, during which it will be so cold that we might face crop failures (as happened in the previous grand minimum in the 1600s).

We need to know what is going on with the Sun, and its consequences for Earth, as soon as possible. Whether we can find out this solar cycle is unlikely, but a cold hard look at the data would do much to answer the question.

I wonder however if there any climate scientists around willing to do so. Questioning human-caused global warming carries great career risks. In fact, taking any position counter to the prevailing wisdom on any scientific issue appears to carry risks, as demonstrated by the experience recently when a journal decided to publish a paper that questioned modern gender politics:
» Read more

Sunspot update Sept 2019:
The blankest Sun in decades

With the release yesterday by NOAA of its September update of its graph showing the long term sunspot activity of the Sun, we find ourselves in what might be the longest stretch of sunspot inactivity in decades, part of what might become the most inactive solar minimum in centuries.

In the last four months the Sun has produced practically no sunspots. There were two in June, two in July, and one in August. The September graph, posted below with additional annotations by me to give it context, shows that the past month was as weak as August, with only one sunspot again.

September 2019 sunspot activity

The graph above has been modified to show the predictions of the solar science community for the previous solar maximum. The green curves show the community’s two original predictions from April 2007, with half the scientists predicting a very strong maximum and half predicting a weak one. The red curve is their revised May 2009 prediction, extended in November 2018 four years into the future.

The 2008-2009 solar minimum was one of the deepest and longest ever recorded. Yet, it never produced a stretch of four months with so few sunspots, as shown in the graph above. Moreover, during that minimum the Sun was blank 71% of the time in 2008 and 73% of the time in 2009 (a record). Right now, with almost three months to go in 2019, the Sun has already been blank 73% of time, with every indication that it will top that number before the year is out.

Furthermore, the trend continues to suggest we are heading for a period of very few sunspots. Though one of the six sunspots seen since June 1 had a polarity that belonged to the next solar cycle, we have seen no further such next-cycle sunspots since July. There was one active region on October 6 with a next solar cycle polarity, but it was never able to gather enough magnetic energy to mature into a sunspot.

As I noted in my July 8 sunspot update,
» Read more

Sunspot update August 2019: Even fewer sunspots

Silso graph for August 2019

Last month I titled my sunspot update “Almost no sunspots,” as there were only two sunspots for the entire month of July, with one having the polarity for the next solar maximum.

August however beat July, with only one sunspot for the month, and none linked to the next maximum. To the right is the Silso graph of sunspot activity for August, showing just one sunspot for the month, on only one day, August 13.

Below is NOAA’s August graph of the overall sunspot cycle since 2009, released by NOAA today and annotated to give it some context.
» Read more

Scientists look at and compare two past grand minimums

In a new paper just published by the American Geophysical Union (AGU), scientists have used tree ring data to analyze and compare the last two past grand minimums, dubbed the Spörer Minimum (1432–1578) and the more well known Maunder Minimum (1640–1720).

The link takes you to the full paper. It is very technical but what it essentially finds is that there appear to be some differences between the two, but more important, during the deepest part of both grand minimums all evidence of the 11 year sunspot cycle (dubbed the Scwabe cycle) vanishes.

A detailed comparison between the Spörer and Maunder (CE 1640–1720) minima shows that the Spörer Minimum is associated with enhanced Δ14C variability in a band centered around the 11‐year Schwabe cycle from CE 1450 to 1479 and between CE 1545 and 1578, whereas little 11‐year variability is observed from CE 1479 to 1539. In contrast, we only observe enhanced 11‐year variability after the end of the Maunder Minimum at CE 1722–1744, which could indicate that the nature and origin of the two minima were different.

In other words, from 1479 to 1539 (Spörer) and 1545 to 1722 (Maunder) the data suggests that we would not have seen sunspots, even with today’s superior observational capabilities.

They base this conclusion by looking at carbon-14 data, which reflects the arrival of cosmic rays on the Earth. When the sun is active cosmic rays decrease. When it is inactive, with no sunspots, cosmic rays increase. This data can be compared with known and more recent sunspot cycles, and can thus provide a robust baseline for determining what the Sun’s behavior was like before the era of the telescope.

Sunspot update July 2019: Almost no sunspots

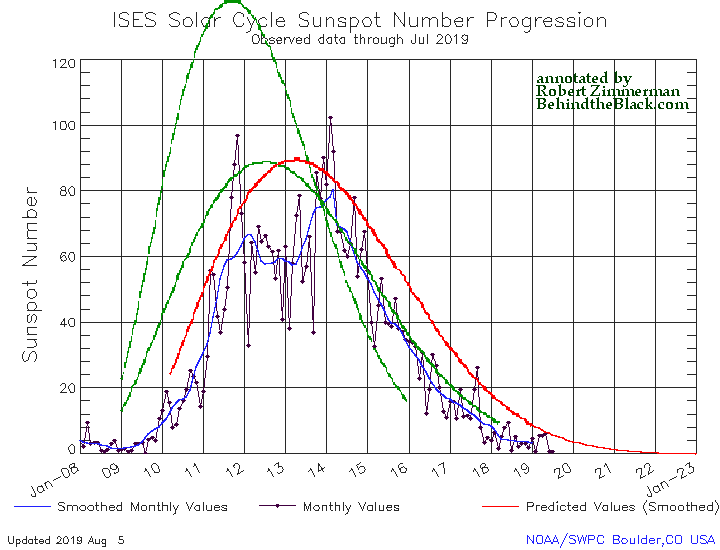
Time for my monthly sunspot update. Below is the July graph of sunspot activity released by NOAA yesterday, annotated to give it some context.

July was about as inactive as June, with only two sunspots appearing during the entire month. As with June, one of those sunspots had the polarity for the next solar maximum, signaling once again the beginning of the next cycle.

July 2019 sunspot activity

The graph above has been modified to show the predictions of the solar science community for the previous solar maximum. The green curves show the community’s two original predictions from April 2007, with half the scientists predicting a very strong maximum and half predicting a weak one. The red curve is their revised May 2009 prediction, extended in November 2018 four years into the future.

We have now seen sunspots with a polarity matching the next solar cycle for two months in a row. In every case those sunspots were weak, lasting only a day or so, but they were visible and trackable, more evidence that we will not see a grand minimum in the coming decade. Whether the next cycle will be weak or not remains unknown, though the data suggests it will be weak.

Sunspot update June 2019: Down to zero again, with next cycle making an appearance

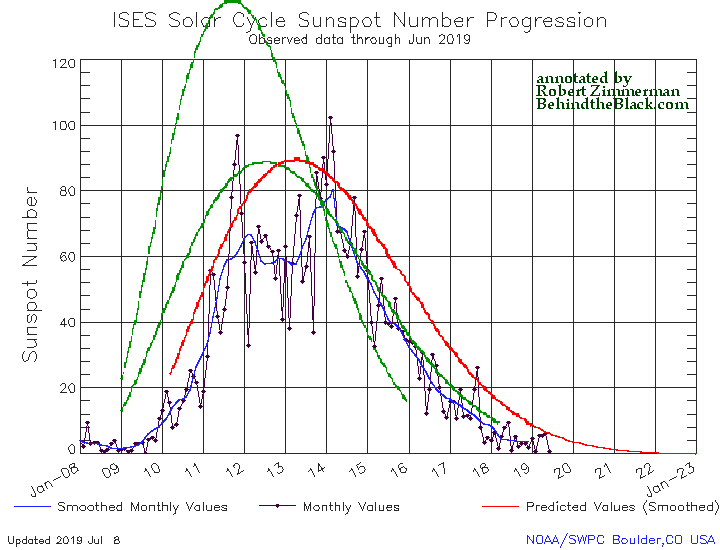
Below is the June graph of sunspot activity released by NOAA yesterday. As I do every month, I am posting it here, annotated to give it some context.

After three months of slightly increased sunspot activity, the Sun in June was essentially blank, with sunspots visible on its facing hemisphere on only five days. In addition, the 36 day stretch of spotless days that began in May and stretched through most of June was the longest such stretch since the last minimum in 2009.
June 2019 sunspot activity

The graph above has been modified to show the predictions of the solar science community for the previous solar maximum. The green curves show the community’s two original predictions from April 2007, with half the scientists predicting a very strong maximum and half predicting a weak one. The red curve is their revised May 2009 prediction, extended in November 2018 four years into the future.

Even while the solar minimum continues and heads for its low point, the first indications of the next solar solar cycle have appeared:
» Read more

New prediction for upcoming solar cycle

The uncertainty of science: A new prediction for the upcoming solar cycle, announced today, calls for a much weaker cycle then the general consensus of the solar science community.

The new prediction:

The forecast for the next solar cycle says it will be the weakest of the last 200 years. The maximum of this next cycle – measured in terms of sunspot number, a standard measure of solar activity level – could be 30 to 50% lower than the most recent one. The results show that the next cycle will start in 2020 and reach its maximum in 2025.

The consensus prediction:

[They] dutifully tabulate the estimates, and come up with a peak sunspot range: 95 to 130. This spells a weak cycle, but not notably so, and it’s marginally stronger than the past cycle. [They do] the same with the votes for the timing of minimum. The consensus is that it will come sometime between July 2019 and September 2020. Maximum will follow sometime between 2023 and 2026.

The main difference is that the consensus expects the next maximum to be weak but stronger than the maximum that just ended, while the new prediction says the next maximum will be the weakest in 200 years.

It has been my impression that there is unhappiness in the solar science community over the consensus prediction. I suspect today’s independent prediction is an indication of that unhappiness. The scientists involved in this research wanted to go on record that they disagree with the consensus.

I expect that NOAA will eventually put the consensus prediction on their monthly sunspot graph that I post here each month. If they do, I might also add this independent prediction so that we can compare the accuracy of the two as the next cycle unfolds.

Sunspot update May 2019: The long ramp down

NOAA yesterday released its May update for the Sun’s sunspot cycle. The graph is posted below, annotated by me to give it some context.

The Sun in May continued to show the exact same amount of activity as it had shown for March and April. This steady uptick in sunspot activity once again shows that the ramp down to full solar minimum will be long and extended.

May 2019 sunspot activity

The graph above has been modified to show the predictions of the solar science community for the previous solar maximum. The green curves show the community’s two original predictions from April 2007, with half the scientists predicting a very strong maximum and half predicting a weak one. The red curve is their revised May 2009 prediction, extended in November 2018 four years into the future.

That we are definitely ramping downward to minimum, even with the slight increase in the past three months, is shown by the fact that the Sun has shown no sunspots for the past fifteen days. In fact, all the activity shown in May comes from the first half of the month. This pattern is actually a reflection of the Sun’s 27-day rotation period. As I noted in my February 2017 update,

January’s activity however illustrated a statistical phenomenon that is typical of the sunspot count. That count is determined not by the numbers of sunspots on the entire surface of the Sun, but on the sunspots visible on the side of the Sun facing the Earth. Since it is not unusual for one face to be more active than the other, as we transition from maximum to minimum the sunspot counts will often show a more pronounced up-and-down curve reflecting this fact. Since the Sun’s day equals about 27 Earth days, this means that about every two weeks the active side will dominate our view until it rotates away and the inactive side reveals itself for two weeks.

In 2017 the number of spots were greater, so the period of inactivity was generally less. Now, it is not unusual for the Sun to be blank for weeks at a time. When it does become active, it is also not unusual for that activity to be confined to one hemisphere, so we get two weeks or less of activity, followed by two weeks or more of blankness.

So far there have been no sunspots in June. Expect that to continue for at least another week, when the more active hemisphere of the Sun returns to face us. I would not be surprise however if that other hemisphere arrives with its sunspots gone, so that the present streak of blankness continues unabated.

Meanwhile, solar scientists struggle to figure out what is going to happen next. Unlike climate scientists, who know as little about the climate, the solar science community admits to its ignorance about the Sun, and the uncertainty of its solar models.

Solar scientists struggle to predict the next sunspot cycle

Link here. This is a detailed article describing the meeting in March where the solar science community gathered to formulate its prediction for the next solar cycle.

What stands out about the meeting is the outright uncertainty the scientists have about any prediction they might make. It is very clear that they recognize that all their predictions, both in the past and now, are not based on any actual understanding the Sun’s magnetic processes that form sunspots and cause its activity cycles, but on superficial statistics and using the past visual behavior of the Sun to predict its future behavior.

“There’s not very much physics involved,” concedes panelist Rachel Howe of the University of Birmingham in the United Kingdom, who has been tasked with reviewing the mishmash of statistical models. “There’s not very much statistical sophistication either.”

Panelist Andrés Muñoz-Jaramillo of the Southwest Research Institute in Boulder agrees with Howe. “There is no connection whatsoever to solar physics,” he says in frustration. McIntosh, who by now has walked downstairs from his office and appears in the doorway, is blunter. “You’re trying to get rid of numerology?” he says, smirking.

The result, as I repeatedly note in my monthly sunspot updates, is that the last prediction failed, and that there is now great disagreement among these scientists about what will happen in the upcoming cycle.

[They] dutifully tabulate the estimates, and come up with a peak sunspot range: 95 to 130. This spells a weak cycle, but not notably so, and it’s marginally stronger than the past cycle. [They do] the same with the votes for the timing of minimum. The consensus is that it will come sometime between July 2019 and September 2020. Maximum will follow sometime between 2023 and 2026.

The range of predictions here is so great that essentially it shows that there really is no consensus on what will happen, which also explains why the prediction has still not been added to NOAA’s monthly sunspot graph. For past cycles the Sun’s behavior was relatively consistent and reliable, making such statistical and superficial predictions reasonably successful.

The situation now is more elusive. For the past dozen or so years the Sun has not been behaving in a consistent or reliable manner. Thus, the next cycle might be stronger, it could be weak, or we might be heading into a grand minimum, with no sunspots for many decades. These scientists simply do not know, and without a proper understanding of the Sun’s dynamo and magnetic field, they cannot make a sunspot prediction that anyone can trust.

And so they wait and watch, as we all. The Sun will do what the Sun wants to do, and only from this we will maybe be able to finally begin to glean an understanding of why.

Scientists propose planetary orbital alignments cause the sunspot cycle

The uncertainty of science: Scientists today proposed a new model that says the orbital alignments of the planets, most especially Venus-Earth-Jupiter, act to initiate the eleven-year solar sunspot cycle.

As with the gravitational pull of the Moon causing tides on Earth, planets are able to displace the hot plasma on the Sun’s surface. Tidal forces are strongest when there is maximum Venus-Earth-Jupiter alignment; a constellation that occurs every 11.07 years. But the effect is too weak to significantly perturb the flow in the solar interior, which is why the temporal coincidence was long neglected. However, the HZDR researchers then found evidence of a potential indirect mechanism that may be able to influence the solar magnetic field via tidal forces: oscillations in the Tayler instability, a physical effect that, from a certain current, can change the behavior of a conductive liquid or of a plasma. Building on this concept, the scientists developed their first model in 2016; they have since advanced this model in their new study to present a more realistic scenario.

More details at the link. To put it mildly, this theory is far from proven. While they mention how it might also cause grand minimums and double-peaked maximums, they are somewhat vague in explaining this process. If valid, however, they should be able to use this model to predict future cycles, including the possible arrival of a new grand minimum in the coming decades.

Sunspot update April 2019: Not quite minimum

Time for the monthly sunspot update: NOAA yesterday released its the monthly update for the Sun’s sunspot cycle, adding sunspot activity for April 2019 to its graph. As I do every month, I have annotated that graph to give it some context and am posting it below.

While the Sun is clearly at the beginning of what might be an extended or very extended solar minimum, the continuing uptick in activity in both March and April illustrates that we have still not arrived at full minimum.

April 2019 sunspot activity

The graph above has been modified to show the predictions of the solar science community for the previous solar maximum. The green curves show the community’s two original predictions from April 2007, with half the scientists predicting a very strong maximum and half predicting a weak one. The red curve is their revised May 2009 prediction, extended in November 2018 four years into the future.

As the Sun ramps down to minimum it will have months where there is no activity, as happened in February 2019, and months, such as in March and April, where more sunspots appear.

Eventually the quiet months will become dominate, and soon thereafter, when activity increases again (assuming it does), the solar science community will then announce the date of true minimum.

We are not there. Normally it can take a year or more for the Sun to settle down. If activity declines as indicated by the red curve, it could take as long four years, which would be a record-long minimum. The difference will tell us whether the eleven-year solar cycle is continuing, or the Sun is heading into a grand minimum, with no significant sunspots for decades.

And as I have said repeatedly in the past five years, a grand minimum could significantly impact the global climate, cooling it. Or not. It is that unknown that will be answered should a grand minimum occur. Circumstantial data suggests an inactive Sun cools the planet, and the arrival of a new grand minimum will allow scientists to confirm or refute that circumstantial data.

Sunspot update March 2019: An upcoming Grand Minimum?

Even though we are now deep into the beginning of what might become the first grand minimum in sunspot activity since the invention of the telescope, that does not mean the Sun has as yet stopped producing sunspots. Yesterday NOAA released its the monthly update of its tracking of the solar cycle, adding sunspot activity for March 2019 to its graph. Below is that graph, annotated by me to give it some context.

It shows the Sun with a slight burst in activity in March, suggesting that though we are now in the solar minimum that minimum still has the ability to produce sunspots.

At the same time, for me to say that we might be heading to a grand minimum, a time period lasting many decades where no sunspots are visible and the sunspot cycle essentially ceases, is not click bait or hyperbole. It is instead based on what I now think the solar science community is thinking, based on this very graph.

March 2019 sunspot activity

The graph above has been modified to show the predictions of the solar science community for the previous solar maximum. The green curves show the community’s two original predictions from April 2007, with half the scientists predicting a very strong maximum and half predicting a weak one. The red curve is their revised May 2009 prediction, extended in November 2018 four years into the future.

For past half dozen or so cycles the solar science community had issued its prediction for the upcoming solar maximum at about this stage in the overall cycle, during the final ramp down to minimum when it was clear that the Sun had entered that minimum.

This cycle’s prediction however has not yet happened, and in fact appears to be late. In fact, the extension of the May 2009 red curve that was made in November 2018 might very well be the only prediction we see. That extension is shown by the differences between the green 2007 prediction and the red 2009 prediction in the graph. Before November 2018 both curves ended at the same place, the end of 2018.

The extension of that red curve is important. As I noted in my December 2018 sunspot update,
» Read more

Sunspot update February 2019: The Sun flatlines again

We are now deep into solar minimum. On Sunday NOAA released its the monthly update of the solar cycle, covering sunspot activity for February 2019. As I have done every month since the start of Behind the Black, I am posting it below, annotated to give it some context.

February 2019 sunspot activity

The graph above has been modified to show the predictions of the solar science community. The green curves show the community’s two original predictions from April 2007, with half the scientists predicting a very strong maximum and half predicting a weak one. The red curve is their revised May 2009 prediction.

For the second time since the beginning of the solar minimum last year, the Sun flat-lined for an month, producing no visible sunspots during the entire month of February.

That streak has continued into March. At present we are four days into March, and still no sunspots.

The big question that I will be repeating probably every month for the next two years is whether we are merely experiencing an early and possibly deep solar minimum, or the advent of a new grand minimum, with no visible sunspots for decades. During the last grand minimum in the 1600s there is evidence the Earth cooled, so much so that it was labeled the Little Ice Age. And with previous grand minimums over the past few thousand years there is evidence that similar coolings occurred. Similarly, periods where sunspot activity was high also appear to have been periods of warmer temperatures.

Why is not clearly understood, though there is some evidence that it might be related to the increasd cosmic ray flux during solar minimum.Those rays might interact with the atmosphere to produce more clouds, thus cooling the Earth. This is not proven however and remains merely a theory linked to some tentative preliminary evidence.

If we do enter a grand minimum, scientists will likely get the answers to these questions. However, we might also find ourselves experiencing significantly colder weather. I am right now flying from Chicago to Columbus, over Lake Michigan, which is filled with ice floes, something we have not seen in March for decades. Nor has this kind of cold weather been unusual for the past decade or so. Could it be because of the weak solar maximum we just experienced and the deep and extended solar minimum just before that? No one knows.

All we can do is gather data, and find out.

Sunspot update January 2019: The early solar minimum

As I have done every month since 2011, I am now posting NOAA’s the monthly update of the solar cycle, covering sunspot activity for January 2019. They posted this update on Monday, and I am posting it below, annotated to give it some context.

January 2019 sunspot activity

The graph above has been modified to show the predictions of the solar science community. The green curves show the community’s two original predictions from April 2007, with half the scientists predicting a very strong maximum and half predicting a weak one. The red curve is their revised May 2009 prediction.

January saw a slight uptick in sunspot activity, but the overall activity remains comparable to mid-2008, when the last prolonged solar minimum began. If you go to my October 2018 update, you can see the graph when it included data going back to 2000 and see the entire last minimum.

That last minimum started in the last half of 2007, and lasted until mid-2009, a full two years. If you look at the red line prediction of the solar science community, it appears that they are expecting this coming minimum to last far longer, almost forever. I expect this is not really true, but that they have simply not agreed on a prediction for the next cycle. Some in that solar science community have hypothesized that we are about to enter a grand minimum, with no sunspots for decades and thus no solar maximum. Others do not agree.

Since neither faction really understands the mechanism that causes these sunspot cycles, there is no way now to determine what will happen, until it does so. What we do know from climate data is that the Earth cools when the Sun is inactive. Why remains unclear, though there is at least one theory, with some evidence, that attempts to explain it.

And despite the untrustworthy claims of NOAA and NASA scientists that the last few years have been hot, experience on the ground disputes this. Their data has been adjusted (tampered if one wants to be more blunt) to make it fit their global warming theory. The raw unadjusted data suggests things have instead cooled, which better fits with the brutal winters Americans experienced for the past decade or so.

If the Sun does enter a grand minimum in the coming decades, I suspect it will become increasingly difficult for NOAA and NASA to continue their temperature adjustments and continue claiming things are getting warmer. At a minimum, we will learn something about the Sun and its behavior and its influence on the climate that we never knew before.

Sunspot update December 2018: Decline to solar minimum continues

Time for the monthly solar cycle update! NOAA today posted its monthly update of the solar cycle, covering sunspot activity for December 2018. As I do every month, I am posting it below, annotated to give it some context.

December 2018 sunspot activity

The graph above has been modified to show the predictions of the solar science community. The green curves show the community’s two original predictions from April 2007, with half the scientists predicting a very strong maximum and half predicting a weak one. The red curve is their revised May 2009 prediction.

There really isn’t much to say about the sunspot activity in December. It continued to show a steady decline to solar minimum, exhibiting activity very comparable to what we saw in mid-2008 when the previous unusually long and extended solar minimum began.

One interested detail however: When NOAA issued this graph last month, it finally extended it out beyond the end of 2019 to the end of 2022. In doing so, it also extended out the 2009 prediction of the solar science community, as indicated by the red curve. I hadn’t commented on this last month, but if you look at that curve it drops to zero and then flatlines for the entire year of 2022.

If this is what the solar science community now expects for this upcoming minimum, it means that community is now expecting a record-breaking minimum, lasting far longer than any previous minimum, two to three years at least. It also means that they have not dismissed the possibility that the Sun is about to enter a Grand Minimum, where no significant sunspot activity is seen for literally decades.

Should such a grand minimum occur, it bodes ill for global warming advocates. The track record of the Earth’s climate consistently shows that when sunspot activity declines, the global climate gets colder. Why this happens is not clearly understood, though there is at least one theory backed up by good experimental data. Should this happen, we shall discover that global cooling is a far worse thing to fear than global warming.

Sunspot update November 2018: Minimum continues

NOAA’s monthly update of the solar cycle, covering sunspot activity for November 2018, was released yesterday. As I have done every month since this website began in July 2011, I am posting it below, annotated to give it some context.

November 2018 sunspot activity

The graph above has been modified to show the predictions of the solar science community. The green curves show the community’s two original predictions from April 2007, with half the scientists predicting a very strong maximum and half predicting a weak one. The red curve is their revised May 2009 prediction.

As I have been expecting now for the last three months, NOAA has finally revised this graph to extend it past the end of 2018. The graph below is the graph from October, which follows the layout and design used since 2007. You can see the differences by comparing the two graphs. In extending the new graph to the end of 2022, they fortunately did not change the design significantly. However, because the new graph has a slightly different scale, I have stretched the green and red curves to make them fit properly. While I suspect the poor quality of the 2007 and 2009 predictions is one reason they do not include them on their graph, I think it essential to add them to better understand the limitations of the science.
» Read more

Solar scientists: sunspot increase in next solar cycle

The uncertainty of science: Using new computer models, two solar scientists are now predicting that the next solar cycle will begin in about a year and will see an increase in sunspot activity, compared to the weak cycle just ending.

Their ensemble forecast surprisingly suggests it could even be stronger than the cycle which is just ending. They expect the next cycle to start rising in about a year following the end of the current sunspot cycle minimum and peak in 2024. Bhowmik and Nandi predict space environmental conditions over the next decade would be similar or slightly harsher compared to the last decade. They find no evidence of an impending disappearance of sunspot cycles and thus conclude that speculations of an imminent Sun-induced cooling of global climate is very unlikely.

Their conclusion is different than other predictions that are claiming a weak next cycle, or even the beginning of a grand minimum, with no suspots at all. Since an real understanding of the sunspot cycle remains elusive, and all these predictions rely on computer models, it is hard to say which will be right. The advantage this particular prediction has is that their model appears able to match what has happened for the past 100 years.

Stay tuned.

Earth’s atmosphere cooling as solar minimum arrives

The uncertainty of science: With the early arrival of the solar minimum, the Earth’s atmosphere has quickly shown signs of cooling.

New research shows that Earth’s upper atmosphere is responding. “We see a cooling trend,” says Martin Mlynczak of NASA’s Langley Research Center. “High above Earth’s surface, near the edge of space, our atmosphere is losing heat energy. If current trends continue, it could soon set a Space Age record for cold.”

These results come from the SABER instrument onboard NASA’s TIMED satellite. SABER monitors infrared emissions from carbon dioxide (CO2) and nitric oxide (NO), two substances that play a key role in the energy balance of air 100 to 300 kilometers above our planet’s surface. By measuring the infrared glow of these molecules, SABER can assess the thermal state of gas at the very top of the atmosphere–a layer researchers call “the thermosphere.”

“The thermosphere always cools off during Solar Minimum. It’s one of the most important ways the solar cycle affects our planet,” explains Mlynczak, who is the associate principal investigator for SABER.

What effect this upper atmosphere cooling will have on the surface climate is somewhat uncertain, though there is a great deal of evidence suggesting the surface climate will cool also.

Sunspot update October 2018: Deepening minimum

The monthly NOAA update of the solar cycle, covering sunspot activity for October 2018, was released yesterday. As I have done every month since this website began in July 2011, I am posting it below, annotated to give it some context.

Though there was a tiny uptick in sunspot activity on the Sun in October, the uptick was inconsequential. Overall, the activity in the past few months appears to closely match the weak activity seen in late 2007 and early 2008, just when the last solar minimum began.

October 2018 sunspot activity

The graph above has been modified to show the predictions of the solar science community. The green curves show the community’s two original predictions from April 2007, with half the scientists predicting a very strong maximum and half predicting a weak one. The red curve is their revised May 2009 prediction.

As I noted in August, the NOAA graph is now getting very close to its right edge, which ends in December 2018. They will very soon have to update this graph so that it can take us into the next solar cycle. While they must do this, it will unfortunately end the standard visual used by them for more than a decade for showing the progress of the solar cycle. Depending on how they change it, I might be able adapt it to include this graph to allow a continuation of the same visual into the future. We will have to see.

Having seen now the full solar maximum for this cycle (weak and short), we are now moving to the next question: Will the developing solar minimum be as long and as deep as the last? Will it evolve into a grand minimum, lasting decades, as some solar scientists believe?

Or will the Sun return to the higher levels of activity seen during most of the 24 solar cycles observed since the last grand minimum in the 1600s?

Since our understanding of these changes is very poor, your guess is likely as good as anyone else’s. All we can really do is keep our eyes open and watch what happens.

Sunspot update September 2018: Minimum!

NOAA yesterday released its monthly update of the solar cycle, covering sunspot activity for September 2018. As I have done every month since this website began in July 2011, I am posting it below, annotated to give it some context.

Sunspot activity on the Sun in September dropped slightly from August. More significantly, the activity continues to match closely the weak activity seen in 2008, when the Sun last went through its last solar minimum. We are unquestionably now in the new minimum, and its arrival in the past few months makes the now-ending solar cycle about one to two years shorter than predicted.

September 2018 sunspot activity

The graph above has been modified to show the predictions of the solar science community. The green curves show the community’s two original predictions from April 2007, with half the scientists predicting a very strong maximum and half predicting a weak one. The red curve is their revised May 2009 prediction.

As I noted last month, the NOAA graph is now getting very close to its right edge, which ends in December 2019. They will very soon have to update this graph so that it can take us into the next solar cycle.

What that new cycle will bring will be the next mystery. I have been following this cycle now since its unusual beginning, with a solar minimum much much longer and more inactive than any solar scientist had ever expected. We can only guess at the surprises the Sun will give us in the coming decade, especially since the science of solar sunspot activity remains superficial and in its infancy. We do not really understand why the Sun’s activity fluctuates. Nor do we understand why it periodically stops producing sunspots for long periods, resulting in what solar scientists call a grand minimum.

There are some scientists who think another grand minimum is coming. We shall have to wait and see. I certainly am going to follow their upcoming observations, as this work remains one of the great scientific studies humans are presently pursuing.

Sunspot update for August 2018: The slide to minimum

As it does the first Sunday of each month, yesterday NOAA posted its monthly update of the solar cycle, covering sunspot activity for August 2018. And as I do every month, I am posting it below, annotated to give it some context.

The Sun in August had a slight uptick in sunspot activity, but not a very significant one. As such, the slide to solar minimum continues. Right now the lack of sunspot activity in 2018 is heading to match or even exceed 2007, the year in which the previous solar minimum began.

August 2018 sunspot activity

The graph above has been modified to show the predictions of the solar science community. The green curves show the community’s two original predictions from April 2007, with half the scientists predicting a very strong maximum and half predicting a weak one. The red curve is their revised May 2009 prediction.

If you look at the original graph at NOAA, you will see that we are getting very close to the right edge of the graph. I expect that sometime in the next few months NOAA will update the graph, a necessary act that will in one sense be a shame, as they have been adding monthly updates to this graph since the beginning of the last solar minimum. This has allowed everyone to see a standard visual, month to month, for comparing solar activity. It has also allowed me to annotate the graph properly to show how the 2007 and 2009 predictions held up against actual activity. Once the graph changes it will be more difficult to do this.

Anyway, it is very clear we are entering solar minimum, and that the solar cycle we are now completing will be both a short and weak cycle. What happens next is really the big question. Will the Sun sunspot activity recover? Or will we enter the first grand minimum since the 1600s? Either way, for solar scientists the coming years are going to be very exciting.

Posted on interstate 10 going from Tucson to Phoenix, on the way to the wooded northern forests of Arizona, where Diane and I will spend a couple of days visiting friends at their upstate cabin/home.

1 2 3 4 5 8