InSight status: Barely hanging on
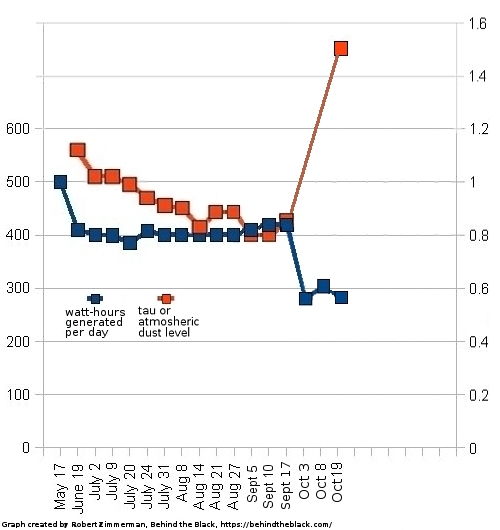
The science team for the InSight lander on Mars today posted an update on the power the spacecraft’s dust covered solar panels are producing. I have added that data to my on-going graph of these power levels, to the right. From the update:
On October 19, 2022, InSight was generating an average between 275 and 285 watt-hours of energy per Martian day, or sol. The tau, or level of dust cover in the atmosphere, was estimated at 1.5 (typical tau levels outside of dust season range from 0.6-0.7).
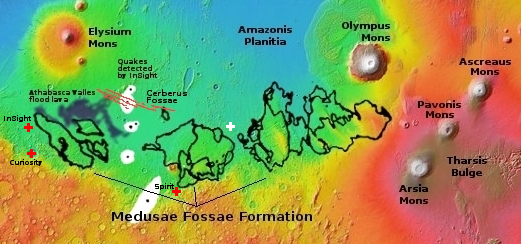
The jump in tau level is due to a large dust storm that developed in September more than two thousand miles away in the southern hemisphere. Though it is so far away, that storm put a lot more dust in the atmosphere above InSight, and forced engineers to shut down all but its most essential functions.
That storm is apparently continuing, and might even be growing. If so, the future of InSight is dim indeed. Any further drop in the amount of power it generates daily will likely make it unable to operate at all, and the mission will end.