
Perseverance gets close to its first cliff

Click for full image.
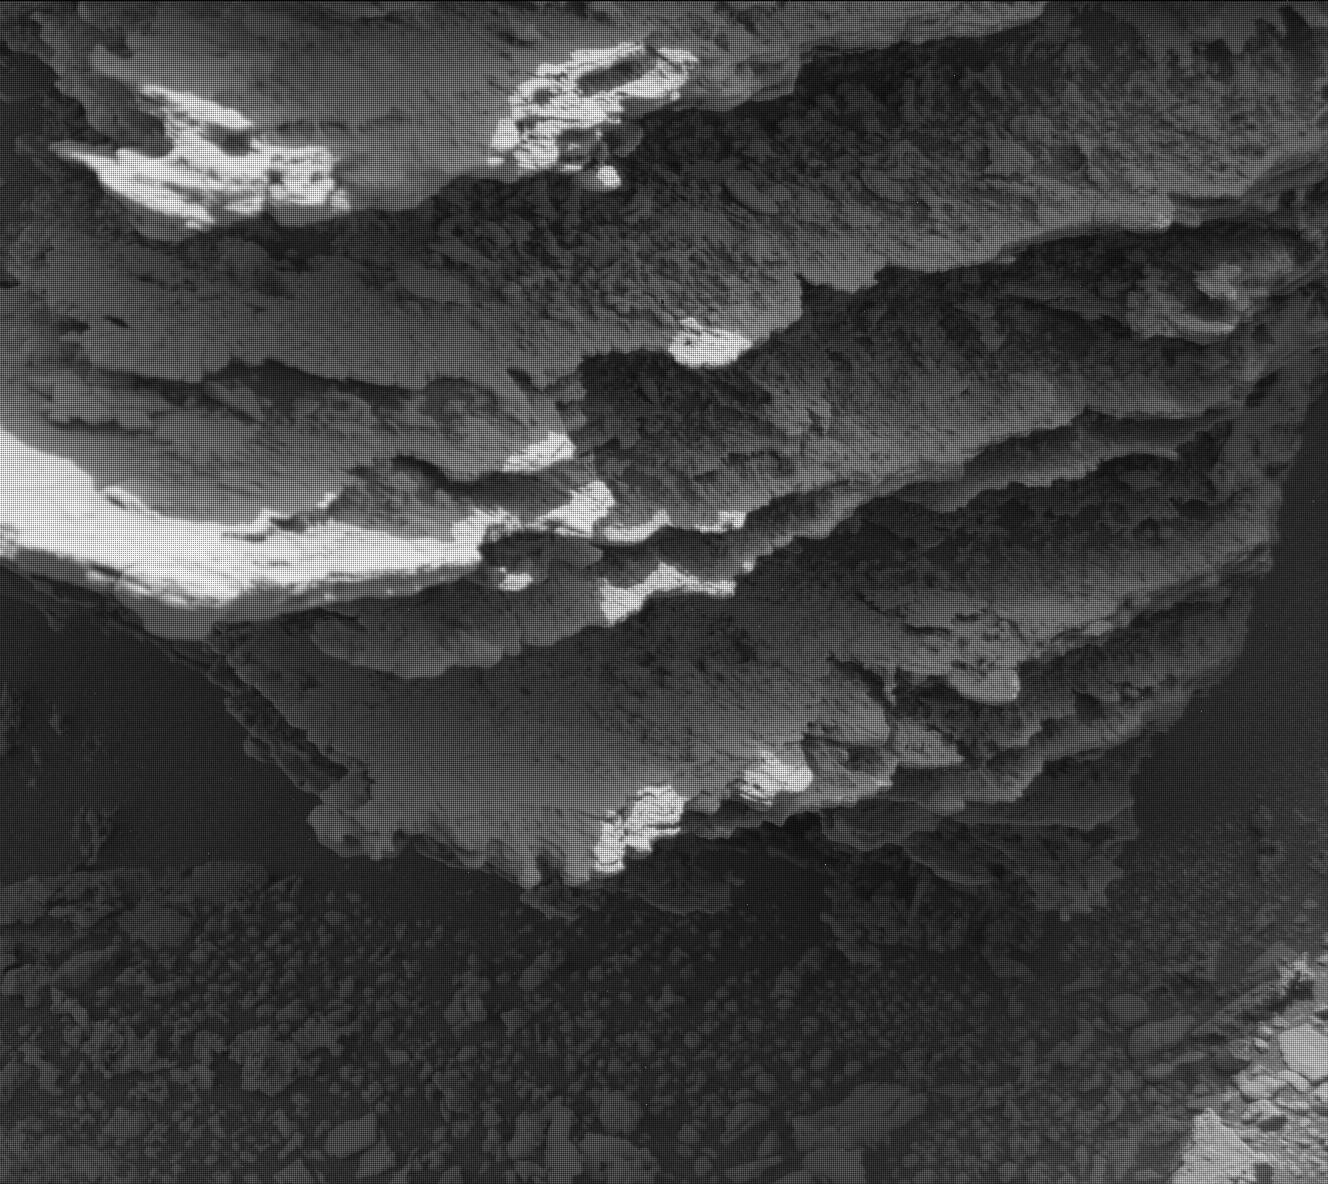
Time for some cool images from Perseverance! The rover, now on Mars for more than a year, has finally begun its journey up the delta of material that some time in the past flowed through a gap in the rim of Jezero Crater. In doing so, it has also finally got close to a nearby cliff, within fifty feet or so, and used its high resolution left mast camera (mastcam) to take the photos to the right. The first, cropped and reduced to post here, was a wider shot taken on June 10, 2022, with the red arrow pointing to the part of the cliff featured in the second image below, taken on June 12, 2022, after the rover had moved in closer. This second photo is also cropped and reduced to post here.
» Read more

