
Blobs in space

Click for full image.
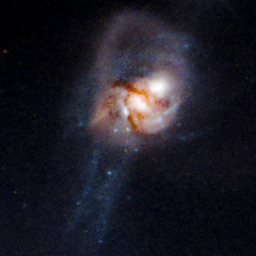
Cool image time! The photo to the right, cropped and reduced to post here, was taken by the Hubble Space Telescope and released today by the science team. From the caption:
This image shows a small region of the well-known nebula Westerhout 5, which lies about 7000 light-years from Earth. Suffused with bright red light, this luminous image hosts a variety of interesting features, including a free-floating Evaporating Gaseous Globule (frEGG). The frEGG in this image is the small tadpole-shaped dark region in the upper left. This buoyant-looking bubble is lumbered with two rather uninspiring names — [KAG2008] globule 13 and J025838.6+604259.
FrEGGs are a particular class of Evaporating Gaseous Globules (EGGs). Both frEGGs and EGGs are regions of gas that are sufficiently dense that they photoevaporate less easily than the less compact gas surrounding them. Photoevaporation occurs when gas is ionised and dispersed away by an intense source of radiation — typically young, hot stars releasing vast amounts of ultraviolet light. EGGs were only identified fairly recently, most notably at the tips of the Pillars of Creation, which were captured by Hubble in iconic images released in 1995. FrEGGs were classified even more recently, and are distinguished from EGGs by being detached and having a distinct ‘head-tail’ shape. FrEGGs and EGGs are of particular interest because their density makes it more difficult for intense UV radiation, found in regions rich in young stars, to penetrate them. Their relative opacity means that the gas within them is protected from ionisation and photoevaporation. This is thought to be important for the formation of protostars, and it is predicted that many FrEGGs and EGGs will play host to the birth of new stars.
The bright red edges of these blobs are places where ionization is occurring, which tells us that the young hot star causing it is to the top, beyond the edge of the picture. Its radiation is also likely causing the blob’s tabpole shape as material is pushed downward away from the star.


